Syllabus
GDES-396 spring 2019 (David Ramos, American University Design)
ramos@american.edu · office hours
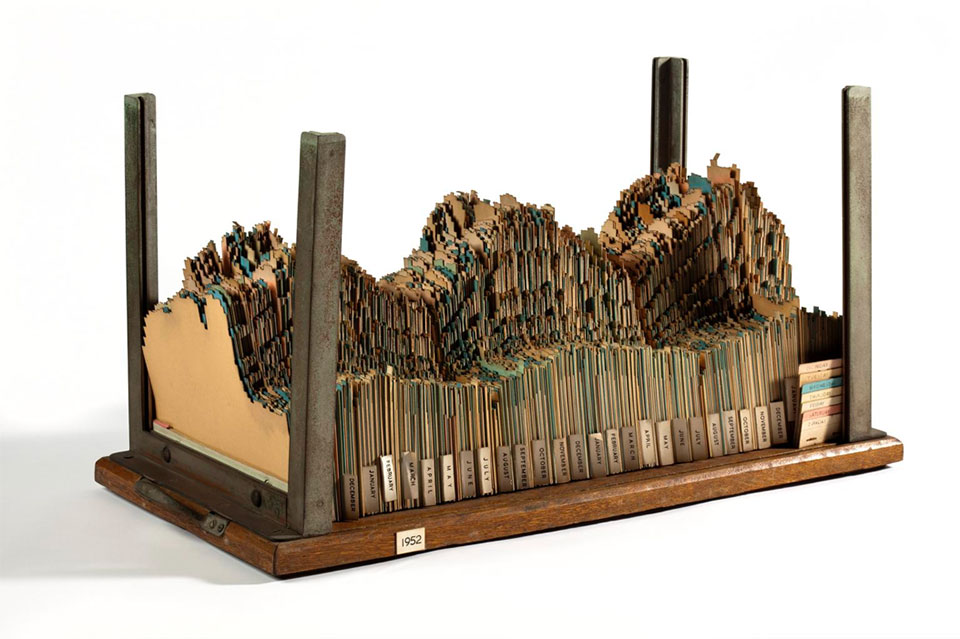
Three-dimensional chart used by Central Electricity Generating Board planners, c.1954. Photo: Science Museum Group, CC BY-NC-SA.
This course examines the design of data visualizations, information graphics, and maps. Through creative projects and exercises, students explore techniques for displaying quantitative and spatial data, explaining complex systems, and shaping numbers into stories. Combines studio practice with reading, technical demonstrations, and supporting lectures.
Learning objectives
You will learn to:
- Reason about and visually explore quantitative data
- Design graphical displays of quantitative information
- Present spatial data on maps
- Employ type, color, and shape in visualizations
- Evaluate visualizations for candor and effectiveness
- Identify the strengths, limitations, and assumptions of datasets
- Use spreadsheets and statistical software for data processing and analysis
- Produce visualizations using statistical and drawing software
- Work with GIS tools
Structure
This is a project-based course. Class meetings will include a mix of demonstrations, discussion, critiques, and studio working sessions. Expect to be doing most of your design work outside of class time.
Design curricula have always been flipped, in some sense, but this course relies on video tutorials for much of the technical material. You might notice that we have shorter class meetings than other AU design courses. Class time focuses on critical, conceptual, and formal issues, and on refining the skills that you initially learned outside of class.
This course assumes that you have a working knowledge of Illustrator or an equivalent vector graphics program, or that you can learn through tutorials. We have introductory demonstrations or tutorials for the Illustrator charting tools, spreadsheets, R and RStudio, QGIS, Mapbox, and Workbench.
The class schedule and assignments are provisional and subject to change.
This course is organized so that students from a wide range of backgrounds can flourish in it. If you say don’t like math, that’s fine, but you have to be interested in thinking about numbers. If you haven’t yet worked with typography and graphic design, that’s also fine, but you have to be willing to learn. No matter your background, though, you need to be curious about a broad array of questions and problems out in the world, and able to explore those issues in detail.
Office hours and contact
An office hours schedule is published elsewhere on your instructor’s site. The best way to reach me outside of office hours is through email (ramos@american.edu). It is department policy not to do critiques over email; plan ahead and take advantage of class time and office hours.
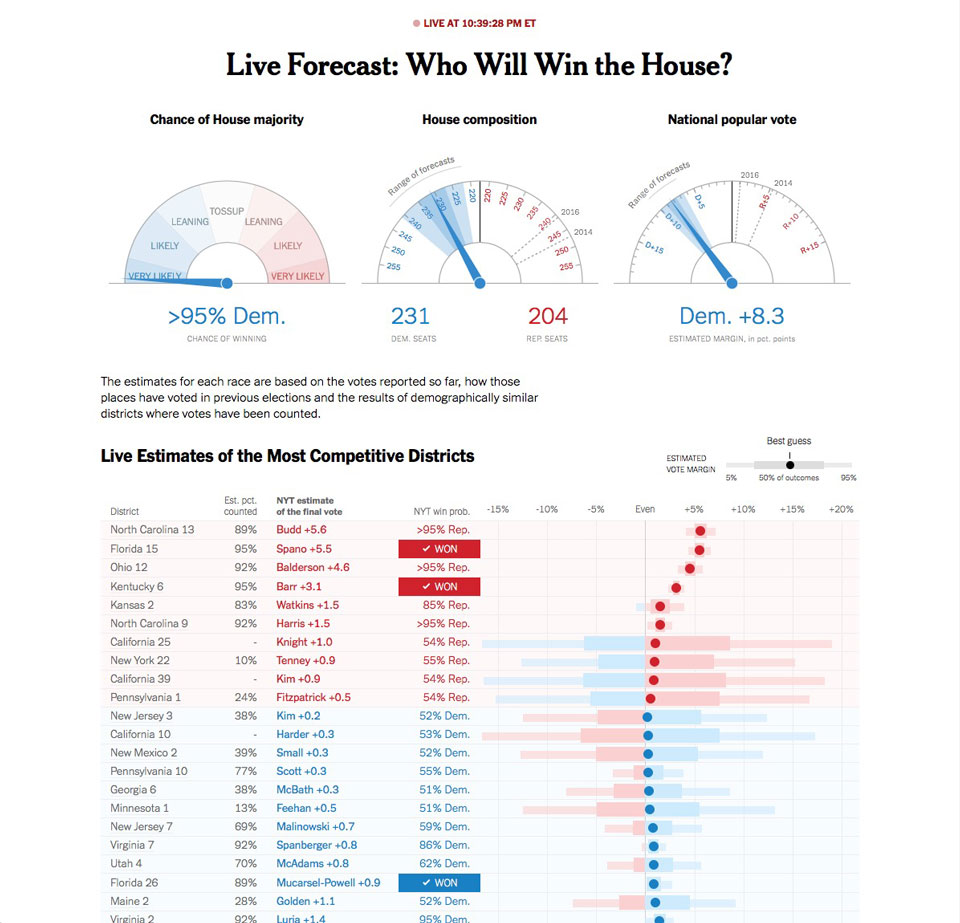
Election results page, designed to convey uncertainty about the final outcomes. New York Times, 6 November 2018 at 10:39 p.m.
Projects and grading
These percentages will change if assignments and schedules change.
- 19% Graded exercises
- 25% Visualization project
- 18% Mapping change project
- 38% Final project
- Participation modifies grade as necessary.
Process and due dates
Projects in this class build through iterations; start early and work consistently. You will need to turn in evidence of your process, so keep versions of your files and paper sketches as they progress. Projects not seen in progress during previous classes will receive a failing grade.
Projects are due at the beginning of class. You may turn in projects at any point up to one week after the due date, without penalty. Grades will drop by one letter (i.e., A- to B-) for every additional week that the project is late.
See instructions for submitting work.
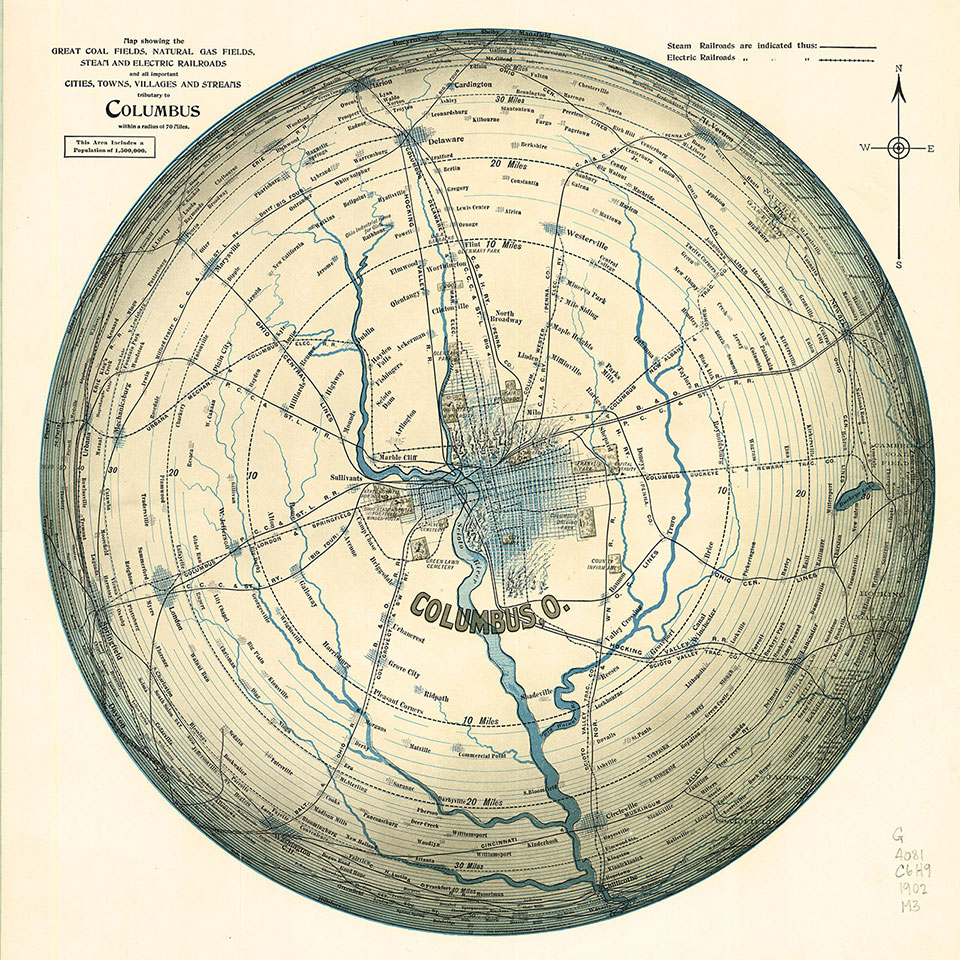
Map of the area 70 miles away from Columbus, Ohio, 1902. Courtesy of UConn Library, CC BY-NC. (original.)
Tools and resources
Textbook
There is one required textbook, along with assigned reading from other sources.
Cairo, Alberto. The Truthful Art: Data, Charts, and Maps for Communication. Hoboken, N.J.: Pearson Education, 2016. ISBN-13: 978-0321934079. author’s site
The book is in course reserves at Bender Library, and is also available in electronic form through the library.
Additional resources
The AU Library provides access to Lynda.com online tutorials. We will be relying heavily on video tutorials for covering technical topics.
Software + tools
This class is relatively tool-agnostic. We’re interested in making effective visualizations, using whatever software serves you best. That said, we will be reading about and working with certain tools in class:
- Workbench (free web application, maintained by the Columbia Journalism School)
- R and RStudio, free or open source, and installed on lab machines.
- QGIS, a free/open source GIS, available on lab machines.
- Mapbox, a software-as-a-service product. The free accounts will serve you well.
- Adobe Illustrator for editing vector graphics and for some simple charting. Illustrator is installed on lab machines, and Adobe offers education pricing.
- A spreadsheet program. Excel, Numbers.app, Google Sheets, and OpenOffice are all fine.
If you would like to do projects in another vector drawing program, like Inkscape or Sketch, those programs might work, but you should not expect help with them.
Lab machines are available, but you must not expect to save work on their hard drives.
You’ll need some other supplies:
- Paper or sketchbook, for sketching and for taking notes
- Technical pens, drawing pencils, and markers (please don’t struggle through sketching with a ballpoint pen)
- Tracing paper (optional)
- Graph paper (possibly)
- USB thumb drive, portable hard drive, or cloud storage account
- A separate drive or account for backup
Keep backups and save versions
Back up your work! and save versions of your projects as you make progress. (More advice on backups and versioning.) Loss of data is not an excuse.
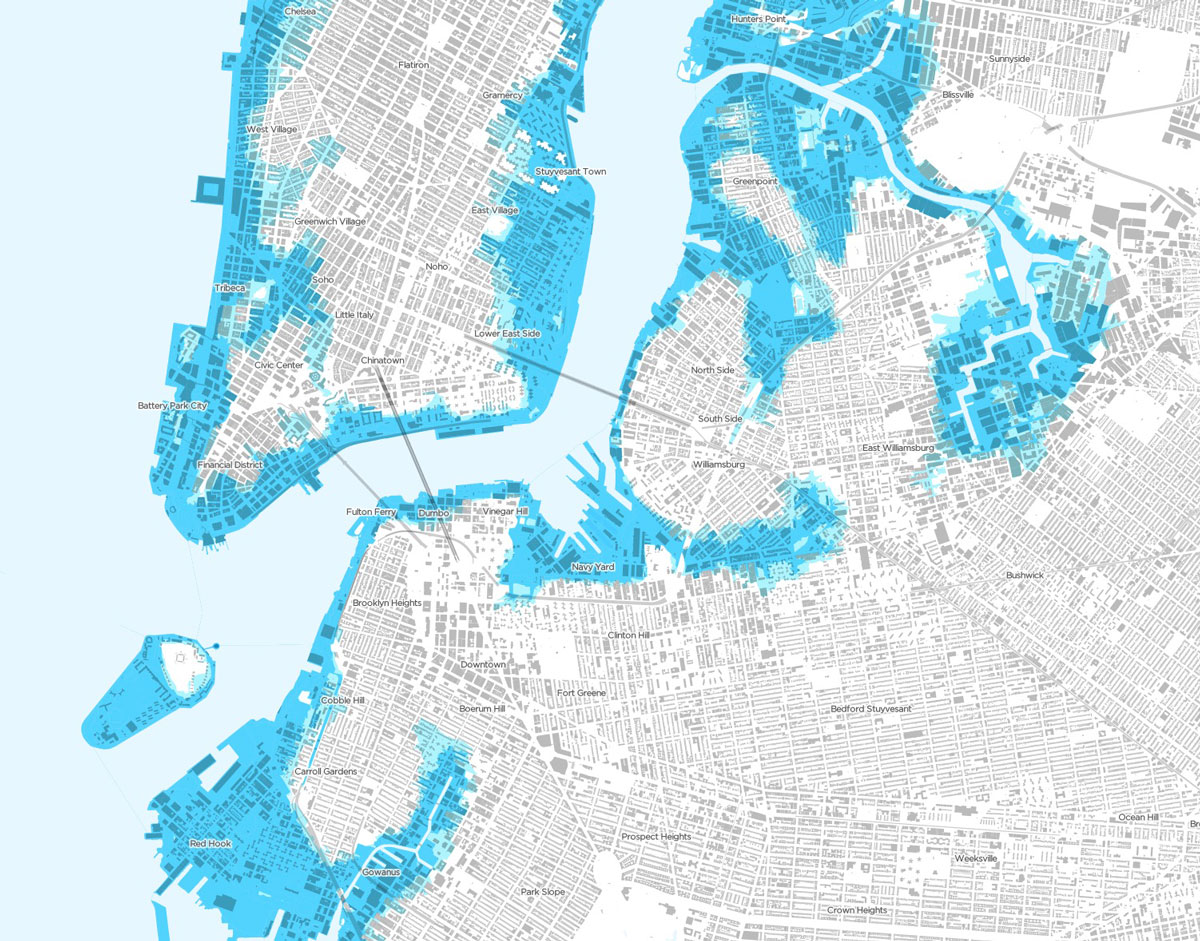
New York City floodplains. Data from NYC OpenData. Map by the instructor.
Policies
Attendance
Students are expected to attend scheduled class sessions. Grounds for excused absences are illness, family emergencies, jury or military service, and religious obligations. One unjustified absence is allowed for the semester. Each additional absence will lower the course grade by one step (i.e. from A to A-).
Come to class on time and do not leave early. Excessive tardiness, early departures, excessive break time, and lack of participation in assigned class activities will count as equivalent to half an absence (2=1 absence). Tardiness over a half hour will be counted as an absence.
Grading scale
Your instructor will use the following grade scale when evaluating projects, with plusses and minuses.
- A 100–90 (“Wow”) This grade indicates work which is clearly superior. It does not mean “satisfactory” or “adequate.” Do not expect to receive an “A” without investing considerable effort, time, and discipline.
- B 89–80 (“Good”) This grade indicates work that is more than merely satisfactory, reflecting strong understanding of the material.
- C 79–70 (“Okay”) This grade indicates work which is merely competent, adequate, and satisfactory. Such work reflects understanding of most of the material covered.
- D 69–60 (“Bad”) This grade indicates work which is unsatisfactory, not competent, or inadequate in terms of presentation or fulfilling the assignment.
- F below 60 This grade is assigned for failure to complete an assignment in a timely and competent manner.
In the classroom
- Silence ringers on phones.
- During discussions and demonstrations, stay off email, texts, and IM.
- Do not use computers for leisure browsing, work for other classes, or anything unrelated to this class. (Exception: if you’ve finished an exercise early.)
Academic integrity and citations
Standards of academic conduct are set forth in the University’s Academic Integrity Code. Please see me or consult the student handbook if you have questions about academic violations described in the Code or as they relate to particular requirements for this course.
Image and code citations: You must provide a citation for any material (including text, images, and source code) from a source outside of the textbook or class demonstrations. See class policy on citations.
Support services
American University offers an array of support services.