GDES-360 spring 2023 / David Ramos, American University Design
Syllabus
Data Visualization
and Information Design
This course examines the design of data visualizations, information graphics, and maps. Through creative projects and exercises, students explore techniques for displaying quantitative and spatial data, explaining complex systems, and shaping numbers into stories. Combines studio practice with reading, technical demonstrations, and supporting lectures.
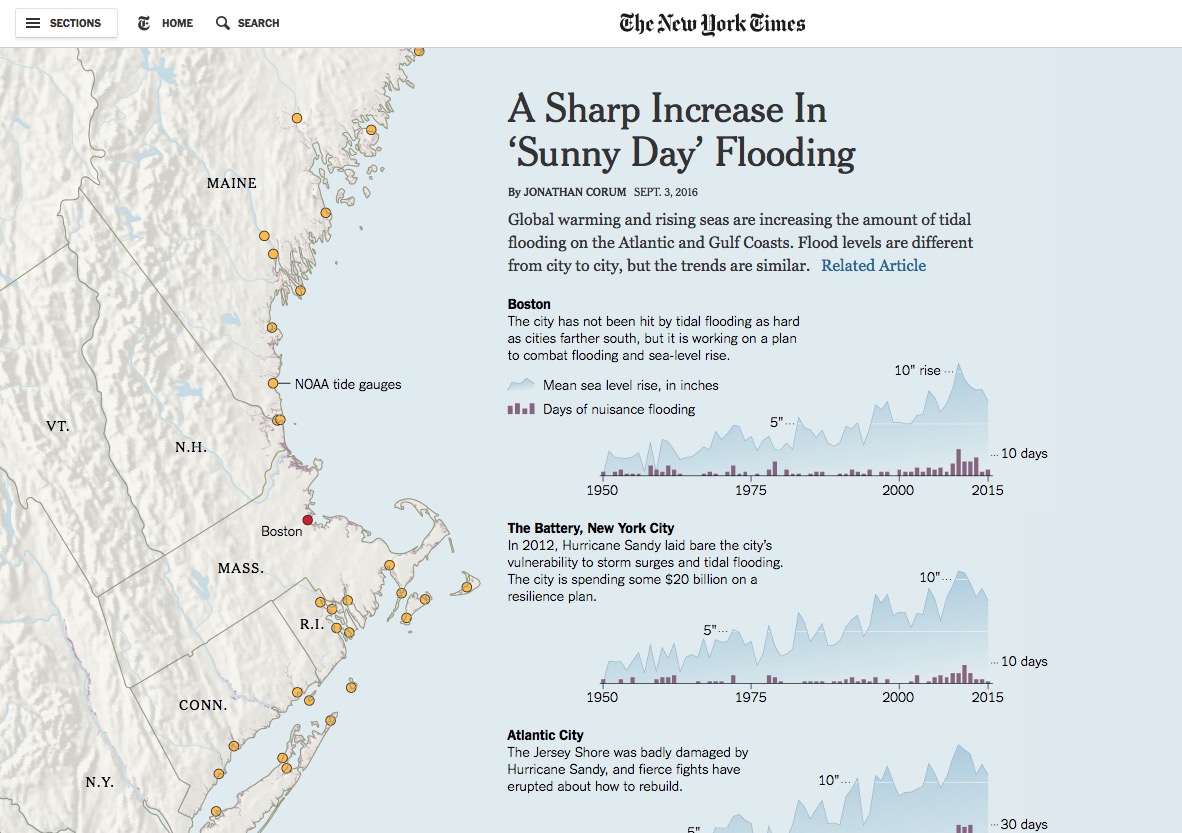
A Sharp Increase in “Sunny Day” Flooding, by Jonathan Corum, New York Times, 2016.
Learning outcomes
You will learn to:
- Reason about and visually explore quantitative data
- Design graphical displays of quantitative information
- Present spatial data on maps
- Employ type, color, and shape in visualizations
- Evaluate visualizations for candor and effectiveness
- Identify the strengths, limitations, and assumptions of datasets
- Use spreadsheets and statistical software for data processing and analysis
- Produce visualizations using statistical and drawing software
- Work with GIS tools

In this course, you will develop the following skills and knowledge:
- Translate real-world questions or intellectual inquiries into quantitative frameworks
- Select and apply appropriate quantitative methods or reasoning
- Draw appropriate insights from the application of a quantitative framework
- Explain quantitative reasoning and insights using appropriate forms of representation so that others could replicate the findings
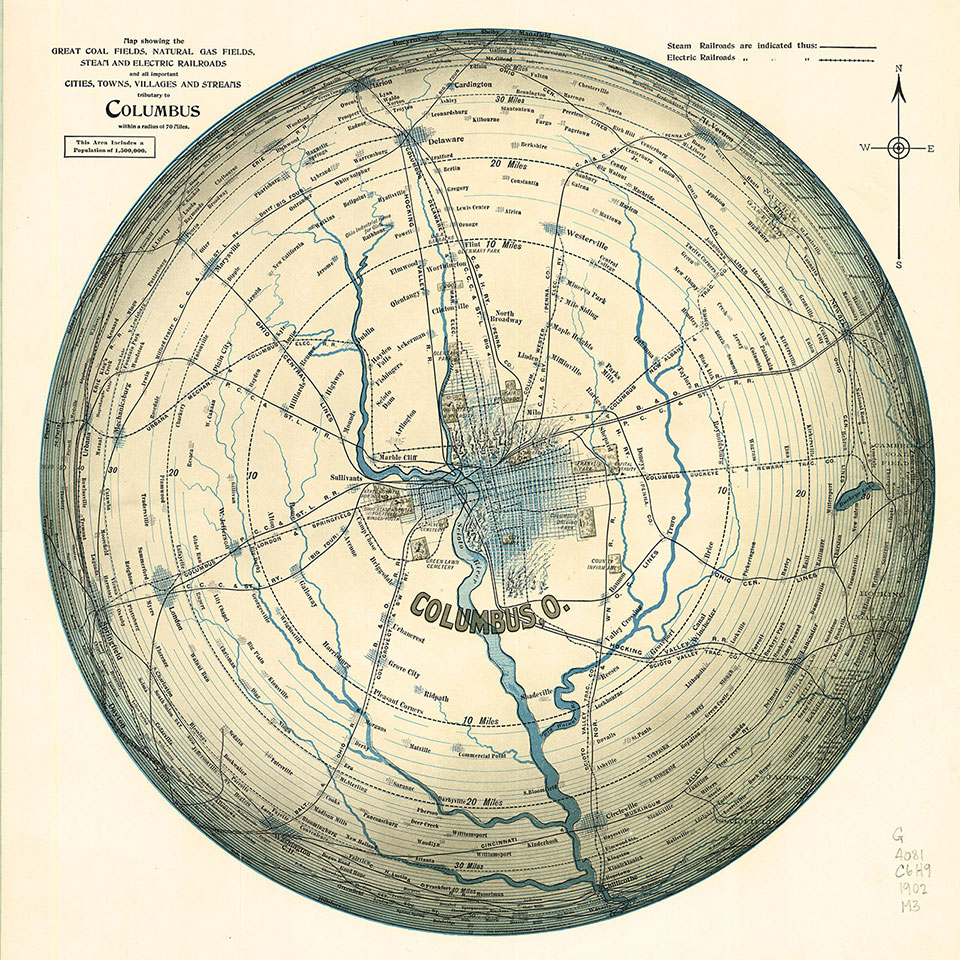
Map of the area 70 miles away from Columbus, Ohio, 1902. Courtesy of UConn Library, CC BY-NC. (original.)
Structure and time
This course is organized around a series of projects. Everything we do—reading, demonstrations, discussion, critiques, and studio work—enables, supports, or responds to those larger projects. As of the start of the semester, the rest of the course is planned to run in-person.
You might notice that we have shorter class meetings than other AU design courses. Class time focuses on critical, conceptual, and formal issues, and on refining the skills that you initially learned outside of class. Most of details of technical, software issues, you will need to learn from the reading. In-class demonstrations and lectures focus on tying together the reading and on offering insights that aren’t readily available offline.
Your background and this class
This course is organized so that students from a wide range of backgrounds can flourish in it. If you say don’t like math, that’s fine, but you have to be interested in thinking about numbers. If you haven’t yet worked with typography and graphic design, that’s also fine, but you have to be willing to learn.
No matter your background, though, you need to be curious about a broad array of questions and problems out in the world, and able to explore those issues through quantitative data. This class is about design; you’ll need to be excited about going farther than the software defaults.
This course assumes that you have a working knowledge of Illustrator or a similar vector graphics program, or that you can learn on your own with tutorials.
Dates and times
All dates and times are Washington, D.C. local time.
Tools, materials, and reading
Reading
There is one required textbook, along with assigned reading from other sources.
Cairo, Alberto. The Truthful Art: Data, Charts, and Maps for Communication. Hoboken, N.J.: Pearson Education, 2016. ISBN-13: 978-0321934079. author’s site
The book is available in electronic form through the AU Library.
Collaboration and communication
- This website is your main source for information. The schedule, assignments, and most course information will be published here. Bookmark this site.
- You’ll turn in work and receive grades on Canvas . Some copyrighted reading will be posted there.
- Our synchronous (real-time) video meetings take place on Zoom. (Link and password are on Canvas .)
- We’ll use Miro for visual comments during discussions and critiques. Accounts are free for students, but you won’t need to sign up. (The password is on Canvas .)
- I’ll send any critical, all-class messages as announcements within Canvas. Check that Canvas will notify you when you receive a message. (How to set Canvas notifications settings.)
Visualization tools
1. Paper
Our very first assignments start on paper. You’ll need paper, graph paper (you can print your own), and pens, pencils, or markers. Tracing paper will help. You’ll still return to paper for sketching out later projects.
Some local art supply stores:
- Plaza Artist Materials, 1120 19th St. NW, Washington, DC (Metro to Farragut North; N busses from Ward Circle)
- Plaza Artist Materials, 7825 Old Georgetown Rd., Bethesda, MD (Metro to Bethesda)
- Dick Blick Art Supplies, 1250 I St. NW, Washington, DC (Metro to McPherson Square or Metro Center)
2. Observable
For the larger projects, though, we will process data and create rough visualizations in the Observable interactive notebook environment. You’ll learn some JavaScript and the Vega-Lite API.
3. Illustrator/vector graphics
You’ll refine and annotate your visualizations using a vector graphics tool. Class demos use Adobe Illustrator (available in the Katzen design labs, the Anderson Mac Lab, and the SOC Open Editing Lab; $20/month on your own computer with a student discount). You can also install Inkscape (free/open source) on your own computer. It lacks Illustrator’s polish and you will have to solve problems on your own.
4. QGIS
We will use QGIS for spatial data and mapping (free/open source; available in Katzen).
5. Spreadsheets
We’ll also use spreadsheet programs for opening data files and performing simple calculations. Excel, Numbers.app, Google Sheets, and OpenOffice will all work.
Software tutorials at LinkedIn Learning
The AU Library provides access to LinkedIn Learning, formerly Lynda.com. We’ll be using the site’s tutorials to cover basic technology skills. (The AU Library provides instructions on how to set up your LinkedIn Learning account.)
Backup and file transfer
Get a USB thumb drive, portable hard drive, or cloud storage account for backup and moving files.
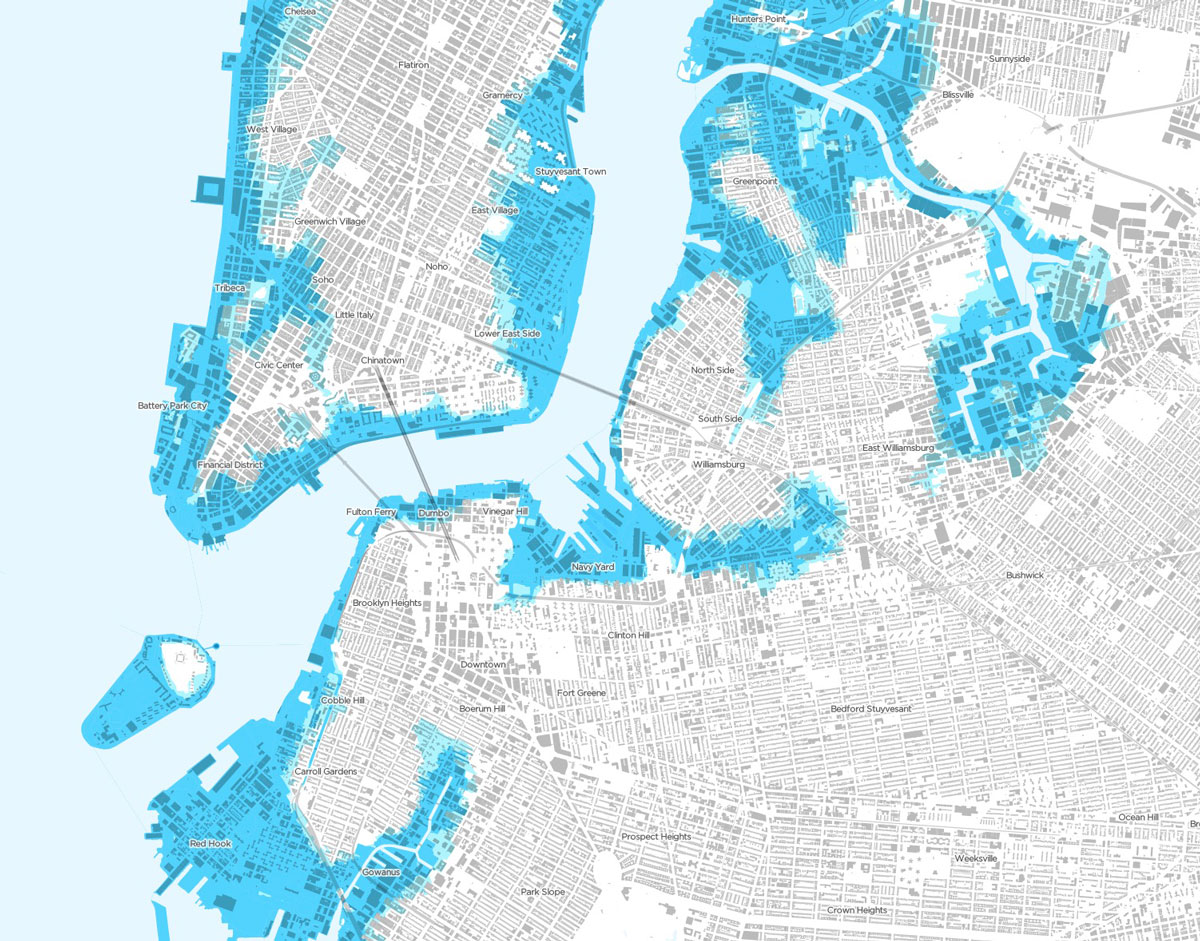
New York City floodplains. Data from NYC OpenData. Map by the instructor.
Policies and expectations
Projects
The course schedule, assignments, and these percentages may change.
| name | % of final grade | |
Introductions | ||
| Encoding data | Encodings and elementary perceptual tasks | 4% |
| Change over time | Time-series data | 4% |
| Ranges of values | Indicating uncertainty | 4% |
| Averages | Comparisons with the whole | 4% |
Large projects | ||
| Colors and space | A more complex series, introducing spatial issues | 35% |
| Spatial/final project | Open, multipart | 45% |
Quizzes | ||
| All quizzes | 4% | |
Process and due dates
Projects in this class build through iterations; start early and work consistently. You will need to turn in evidence of your process, so keep versions of your files and paper sketches as they progress. Projects not seen in progress during previous classes will receive a failing grade.
Projects are due at the beginning of class, if you want to stay on schedule. You may turn in or resubmit projects through the final deadline (during exam period—see the class schedule) without penalty.
Grading scale
- A/A- (excellent) Work that is clearly superior.
- B+/B/B- (good) Work that reflects a strong understanding of the material.
- C+/C/C- (fair) Work that shows basic competence and fulfills the requirements of the assignment.
- D (poor) Work that is unsatisfactory or inadequate.
- F (failing) This grade is assigned for failure to complete work in a timely and competent manner, or for non-attendance.
Attendance, the classroom, and Covid–19 precautions
Plan to come to class. That said, you can miss one class, for any reason, without penalty. Additional unexcused absences or missed class time will count against your course grade, which drops by 4% for each unexcused absence.
If you feel sick, stay home. Do not come to class. Get in touch with me about how to make up missed work. I’d prefer that you miss class, get well soon, and keep everyone else safe.
Your absence is excused if you’re sick, have religious observances, encounter family emergencies, or are called for military or jury service. You do not need to provide a note, but let me know by email.
In the classroom, conduct yourself professionally. Do not record audio or video; if you need a recording, your instructor will arrange for one.
We will follow university policies and District of Columbia orders about virus protection measures, including masking.
Citing sources and academic integrity
You’ll need to provide citations for every piece of work that you didn’t make yourself. This includes words, images, ideas, data, and code. It includes images that you edited, images that you traced, and even images that you merely used as references for your own illustrations.
We will discuss the advantages, potential roles, and dangers of AI-generated text and images. If you use AI tools for any part of a project, add a note to your citations that describes what you did and what software you used.
When you turn in a project, include a list of citations. Use MLA or Chicago format.
Standards of academic conduct are set forth in the university’s Academic Integrity Code. See your instructor if you have questions about academic violations described in the code, as they apply in this course.
Support
Contact
The best way to reach me is through email (ramos@american.edu); I typically check email on weekday mornings.
University services
American University offers an array of support services.