GDES-360 spring 2023 / David Ramos, American University Design
Spatial + final project
Produce an information graphic that combines spatial and quantitative data, on a topic that you propose.
Start by exploring topics. Write up a one-paragraph proposal that details the question you want to explore, the datasets you will work with, and the visualization formats that you plan to use.
As with previous projects, move through an iterative design process: gather data, generate rough visualizations and improve them in a drawing tool, and use drawing tools to combine several visualizations on a page. Refine your work on the basis of advice you receive in critiques.
Specifications and requirements
- Design for print or, with instructor permission, as an interactive piece.
- Any trim size and format. You should strongly consider one or two 11×17 in. sheets.
- Use at least four separate visualizations, including at least one map. (Strongly consider one set of time-series data.)
- The map can serve as a locator map, or can be a basemap on which you overlay quantitative data.
- Explain your ideas using a main title, subtitles and captions, and explanatory text.
- Provide citations for your data, small, somewhere on the final piece.
- Turn in a PDF to Canvas that includes the final, as well as versions from each week.
Evaluation
- Are the visualization formats appropriate to the data?
- Are visualizations correct?
- Do the visualizations include visual and typographic aids? Are there extraneous, distracting graphical elements left over from charting software?
- How effective are color, type, and graphical choices?
- Do the labels help explain the visualizations?
- How thorough is the research?
- Do the visualizations and text explain the issue?
- How much has the project improved over time?
Data source tips
- See a list of data sources maintained by the AU Library.
Examples
Examples of work that combines mapping with other visualization methods. Look at these for technique only. Of these, only the New York Times flooding piece would meet expectations for this assignment.
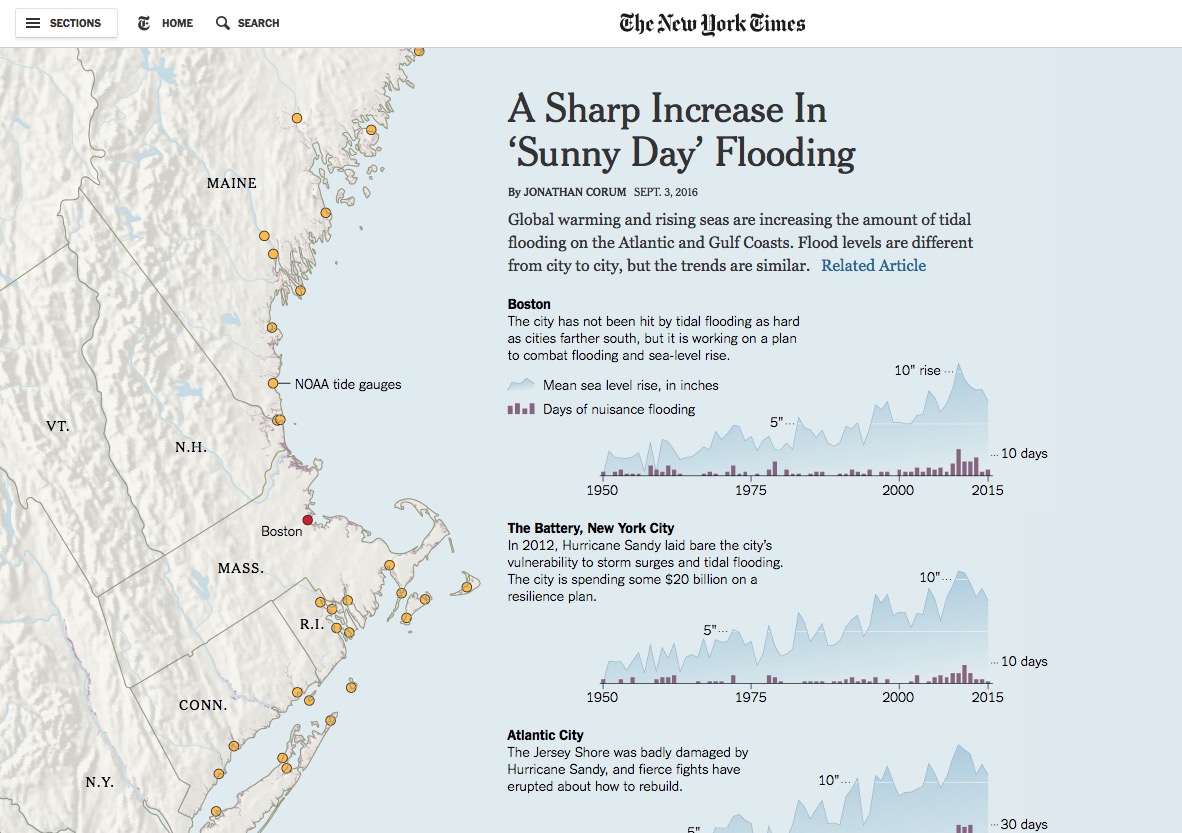
A Sharp Increase in “Sunny Day” Flooding, by Jonathan Corum, New York Times, 2016.
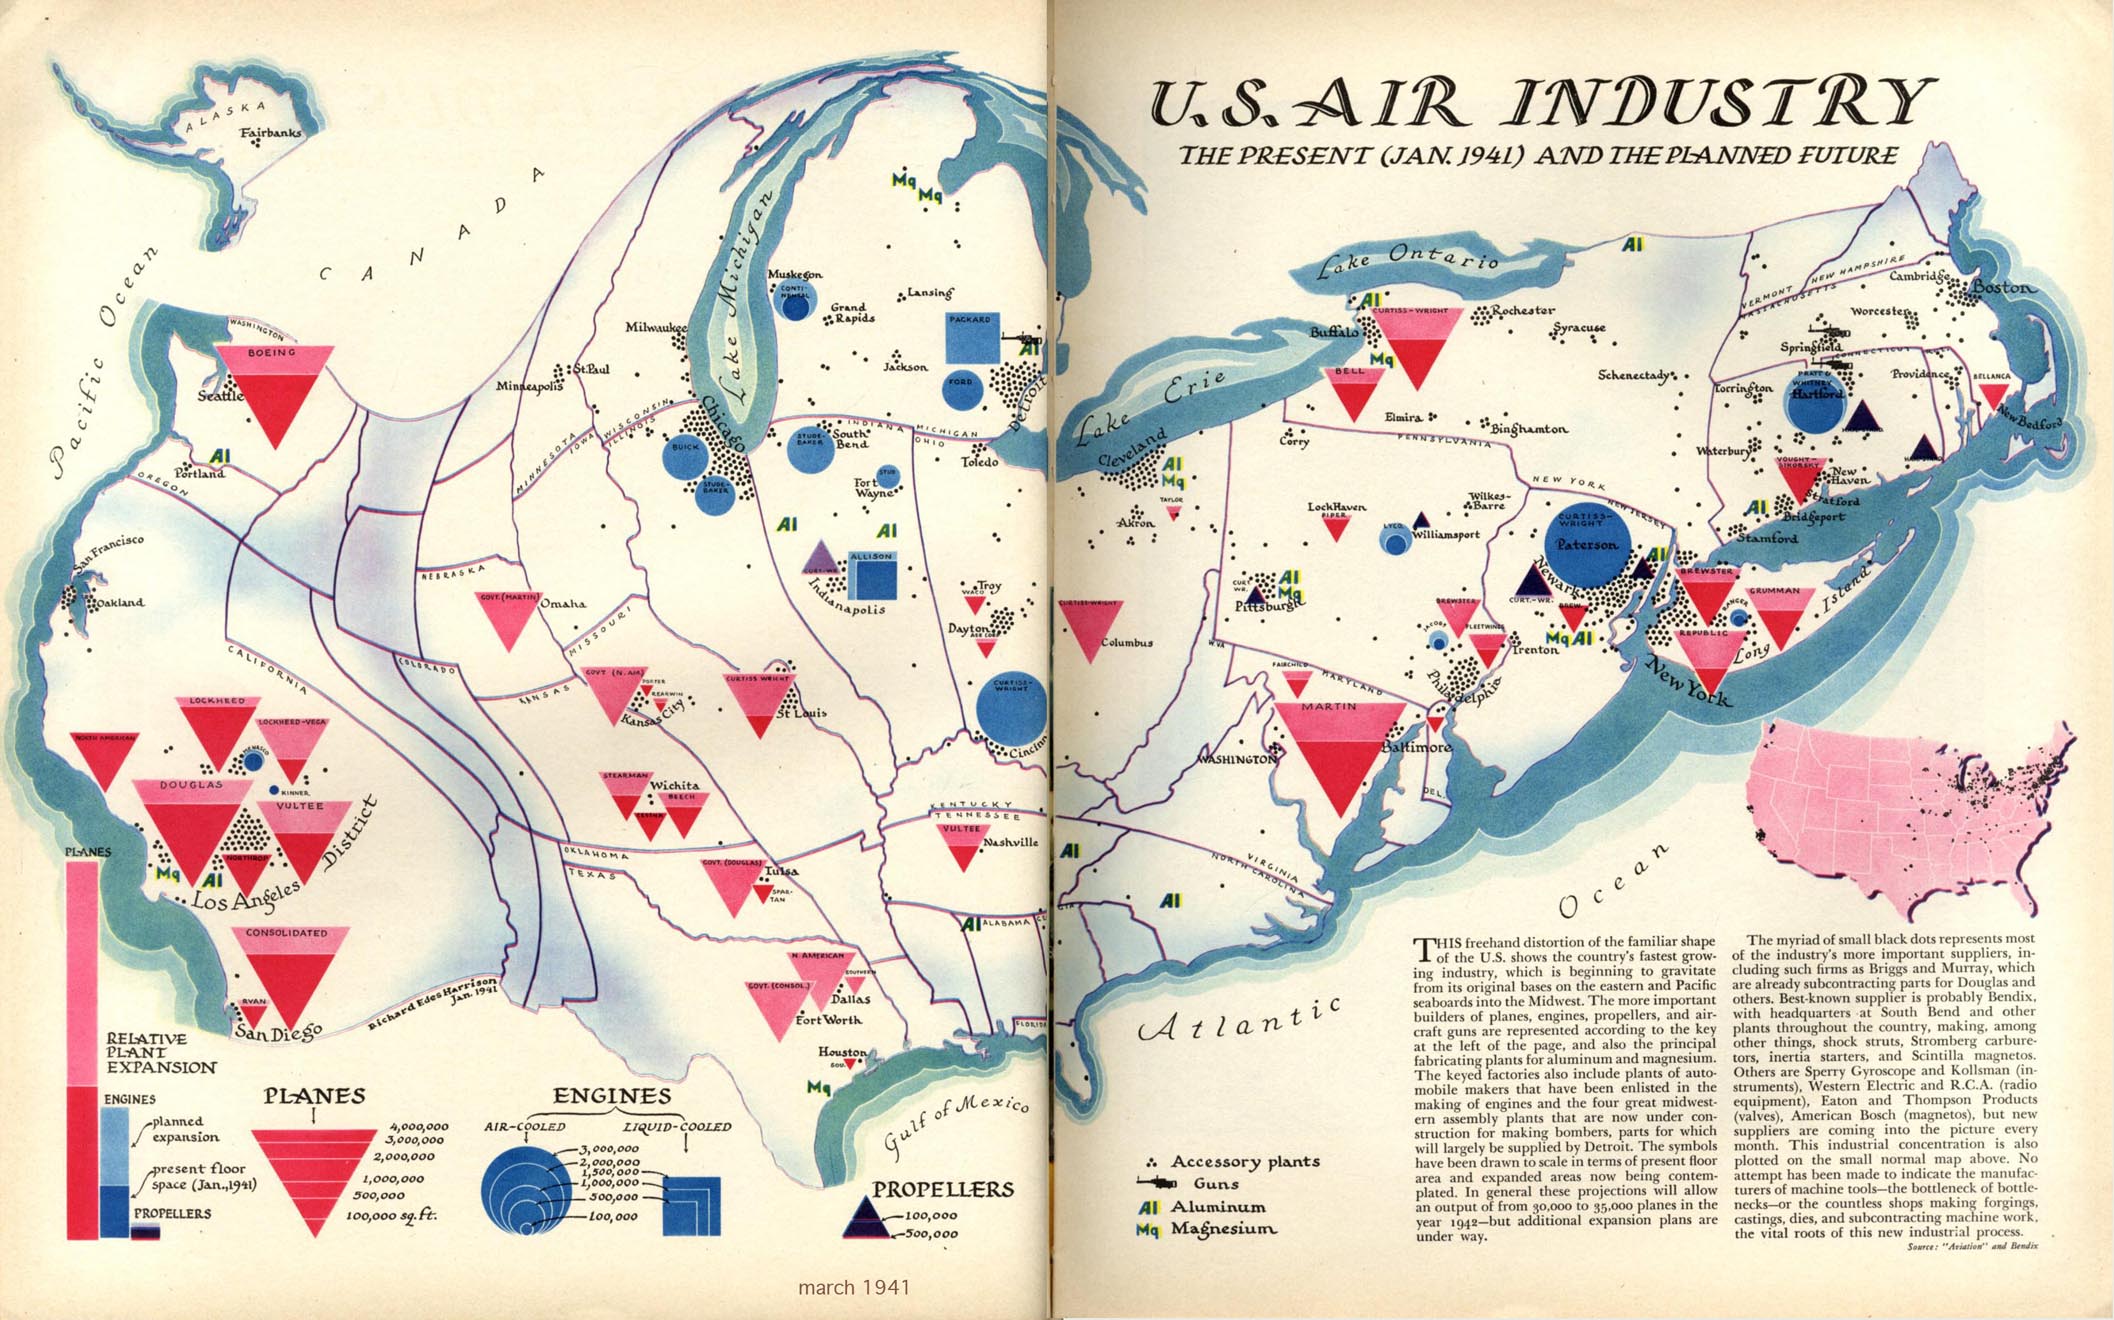
From Fortune, 1941. By Richard Edes Harrison.
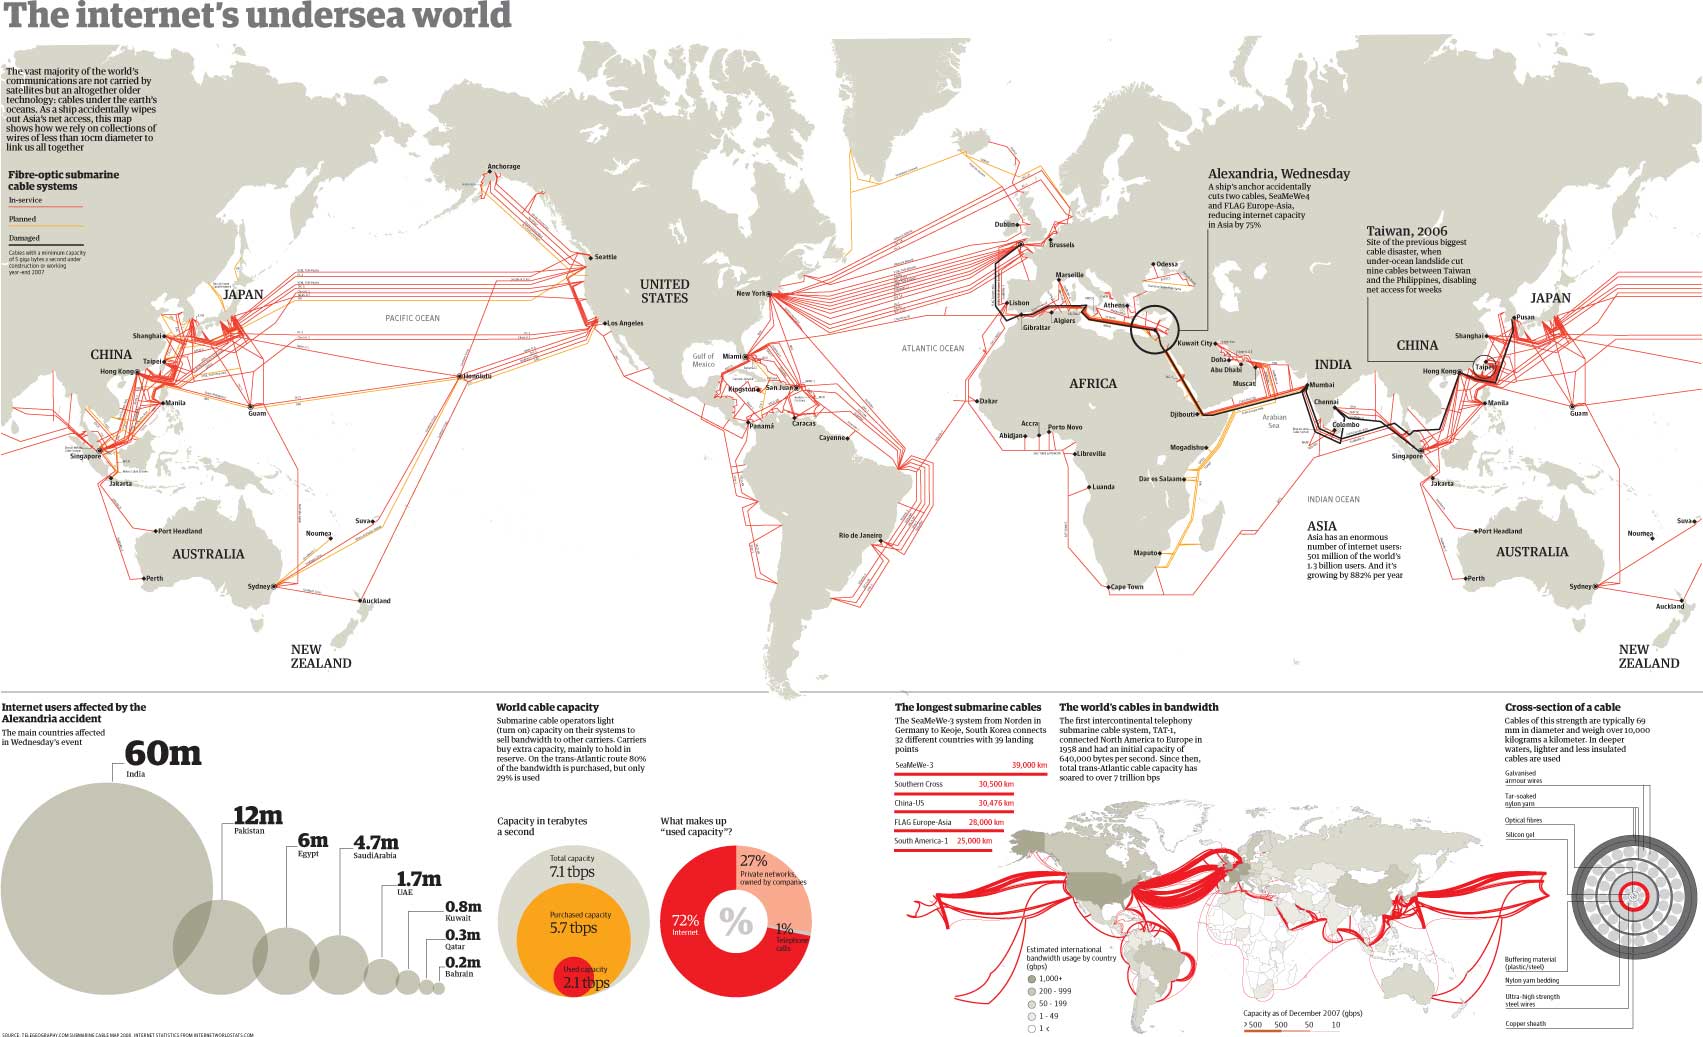
The Guardian
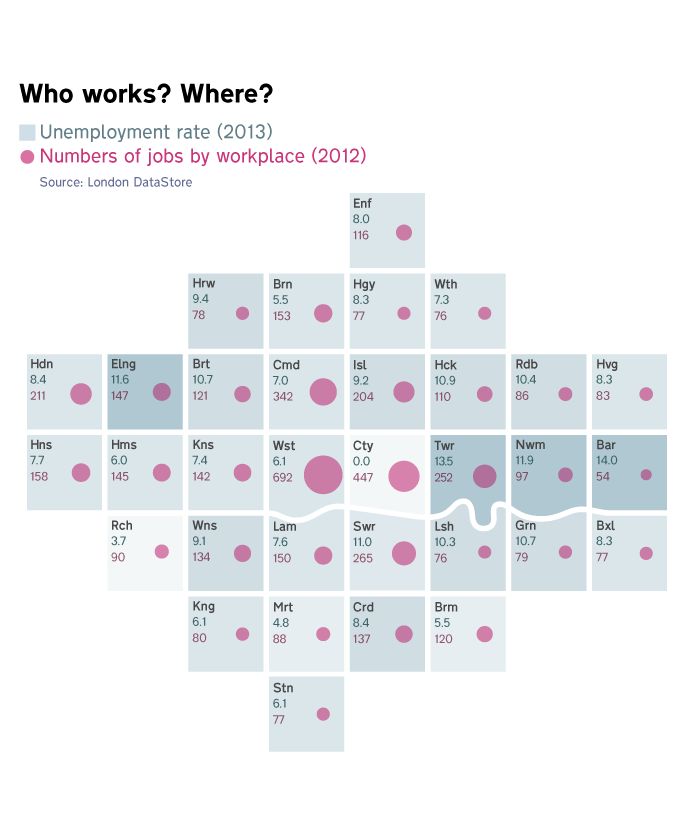
London Squared, by After the Flood