GDES-360 spring 2023 / David Ramos, American University Design
Change over time
Explore population data for U.S. states and regions, past and present, find insights within those data, and communicate those insights in a visualization.

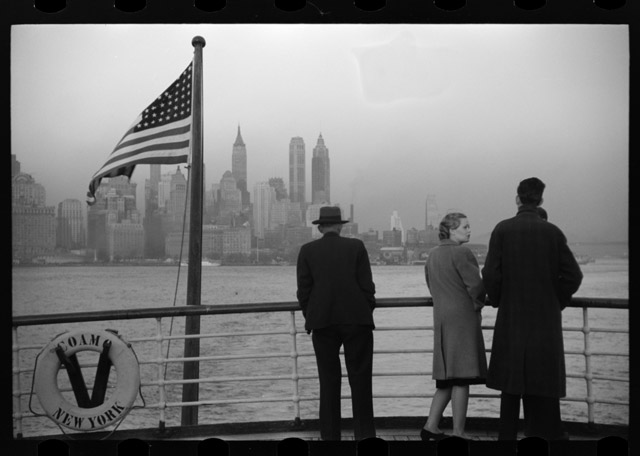
Lower Manhattan seen from the S.S. Coamo leaving New York. Jack Delano, Farm Security Administration, December 1941. (Library of Congress.)
Explore state and regional data
Start by looking at what’s in the data. Spend time with the rough, exploratory visualizations here. Try turning certain states and regions on and off.
Places change
The 1830 Census showed Baltimore as the second largest city in the country, but it is 30th today. Washington, D.C.’s population had been falling since just after WWII, but it recently rebounded and just hit 700,000. Detroit’s population plummeted in recent decades, forcing city leaders to make plans to help the city shrink. We can see similar changes among states.
You do not (necessarily) need to plot a century worth of Census data. It might be more illuminating to show us two or three years, especially if you are comparing several states.
On to design
As with the previous assignment, produce two versions. Make one version as legible and understandable as possible, and have the other express the meaning in the most compelling or intriguing way.
Your final project can be rough in the sense that type, color, and rendering need not be polished. (You can produce this by hand.) What’s important is that you think about techniques for visualizing change over time. Details still matter—they just don’t need to be finessed in software.
Each version might consist of a single visualization (that is, one figure), but you could also arrange several visualizations on the same page.
As always, see the course schedule for deadlines.
Method
Look at the data in Observable
Start with the data in the Observable notebook and the visualizations of those data. You’ll certainly need to filter the dataframe down to less than 50 states and several regions. Look at the numbers; look at the visualizations. Think about what you’re seeing, and identify something you’d like to explore father.
Generate rough visualizations
Working in Observable, find or create visualizations that help you answer your question. This notebook already contains several visualizations, and they might already be enough for you to build on. You might want to make small changes, or if you’re quickly gaining fluency in JavaScript and the Vega-Lite API, you might try to generate something on your own.
Download a rough visualization from Observable. Click on the three-dot menu next to a graphic, then “Download SVG.”
Refine and redesign your visualizations
Think about how you need to refine these visualizations. Add space? Change colors? Remove lines, thicken lines? Insert a title?
You have a choice about whether you’re going to proceed by hand, or whether you want to continue on the computer. Think very carefully about your vector graphics skills—if you have any doubts, you’re probably better off working by hand.
- If you’d like to work by hand, print the visualization, then use that printout as a guide for preparing the final pieces. You could trace directly over the printed graphics.
- Alternatively, if you’re improving the graphic on a computer, edit this SVG with your vector graphics tool (i.e., Illustrator) and edit it.
You could even use these rough visualizations as guides for creating very different graphics. For ideas about ways to approach this task, see chapters 5 and 8 from The Truthful Art. You might also look at the Showing Data Over Time selections at the Data Visualisation Catalogue, though not all of these choices are appropriate for the data or for your schedule.
Specifications
- Trim size: up to 11×17 in., any orientation. It should probably be flat, but you’re welcome to surprise us.
- Color, grayscale, or black-and-white.
- The reader is generally curious person with at least a high school education, holding your piece at a normal reading distance for a book or a magazine.
- Provide labels and numerical values, but not necessarily for everything.
- A title is necessary, and an introduction will probably help. Please put your name on this.
- Provide notes about your sources, enough that we know where you got the data from. “U.S. Census, Historical Population Change Data (1910-2020)” would suffice.
- Print this for critique.