Jan 20 Week 01
No class (Inauguration Day)
Start Dear data
GDES-360 spring 2021 / David Ramos, American University Design
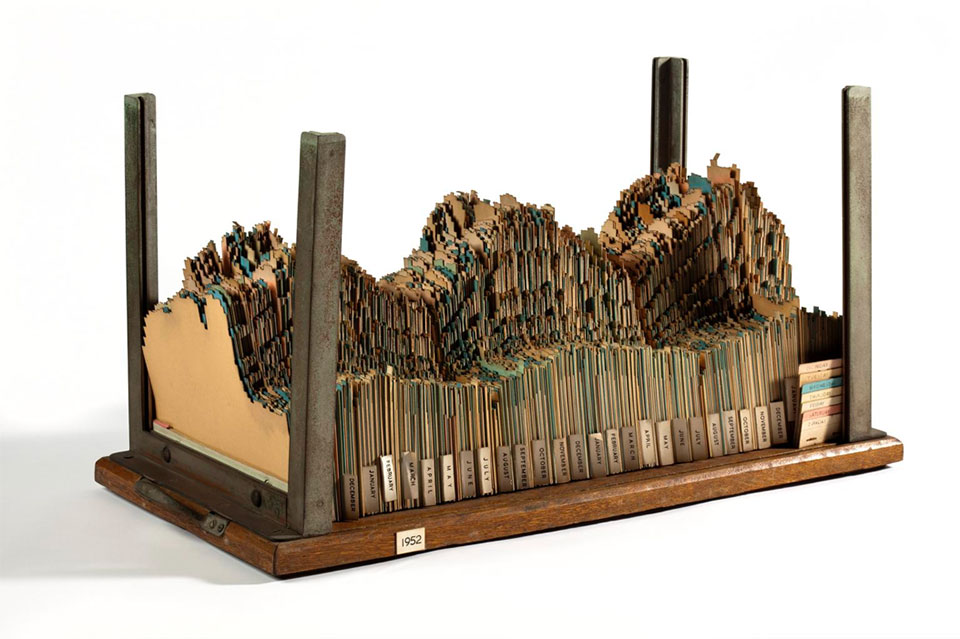
Three-dimensional chart showing electricity demand in the Manchester, England area, hour-by-hour and day-by day, 1951–1954. Photo: Science Museum Group, CC BY-NC-SA. (more)
Jan 20 Week 01
No class (Inauguration Day)
Start Dear data
Jan 27 Week 02
Intro / Encodings + elementary perceptual tasks
Finish Dear data / Start Encoding data
Feb 3 Week 03
Visualizing change + workflows
Finish Encoding data / Start Change over time
Feb 10 Week 04
Visualizing comparisons
Feb 17 Week 05
Means, medians, and distributions
Finish Change over time / Start Neighborhoods
Feb 24 Week 06
Color
Mar 2 Week 07
Cartographic principles
Mar 9 Week 08
Wellness Week
Mar 16 Week 09
Issues in mapping
In-progress critique
Mar 23 Week 10
Introducing mapping tools
Mar 30 Week 11
Typography, symbols, and line
Finish Neighborhoods / Start Spatial
April 6 Week 12
Critique
April 13 Week 13
Critique
April 20 Week 14
Closing
In-progress critique
May 4
Exam period
All work due