Final project
GDES-396 spring 2020 (David Ramos, American University Design)
ramos@american.edu · office hours
Produce an information graphic that combines spatial and time-series data, on a topic that you propose.
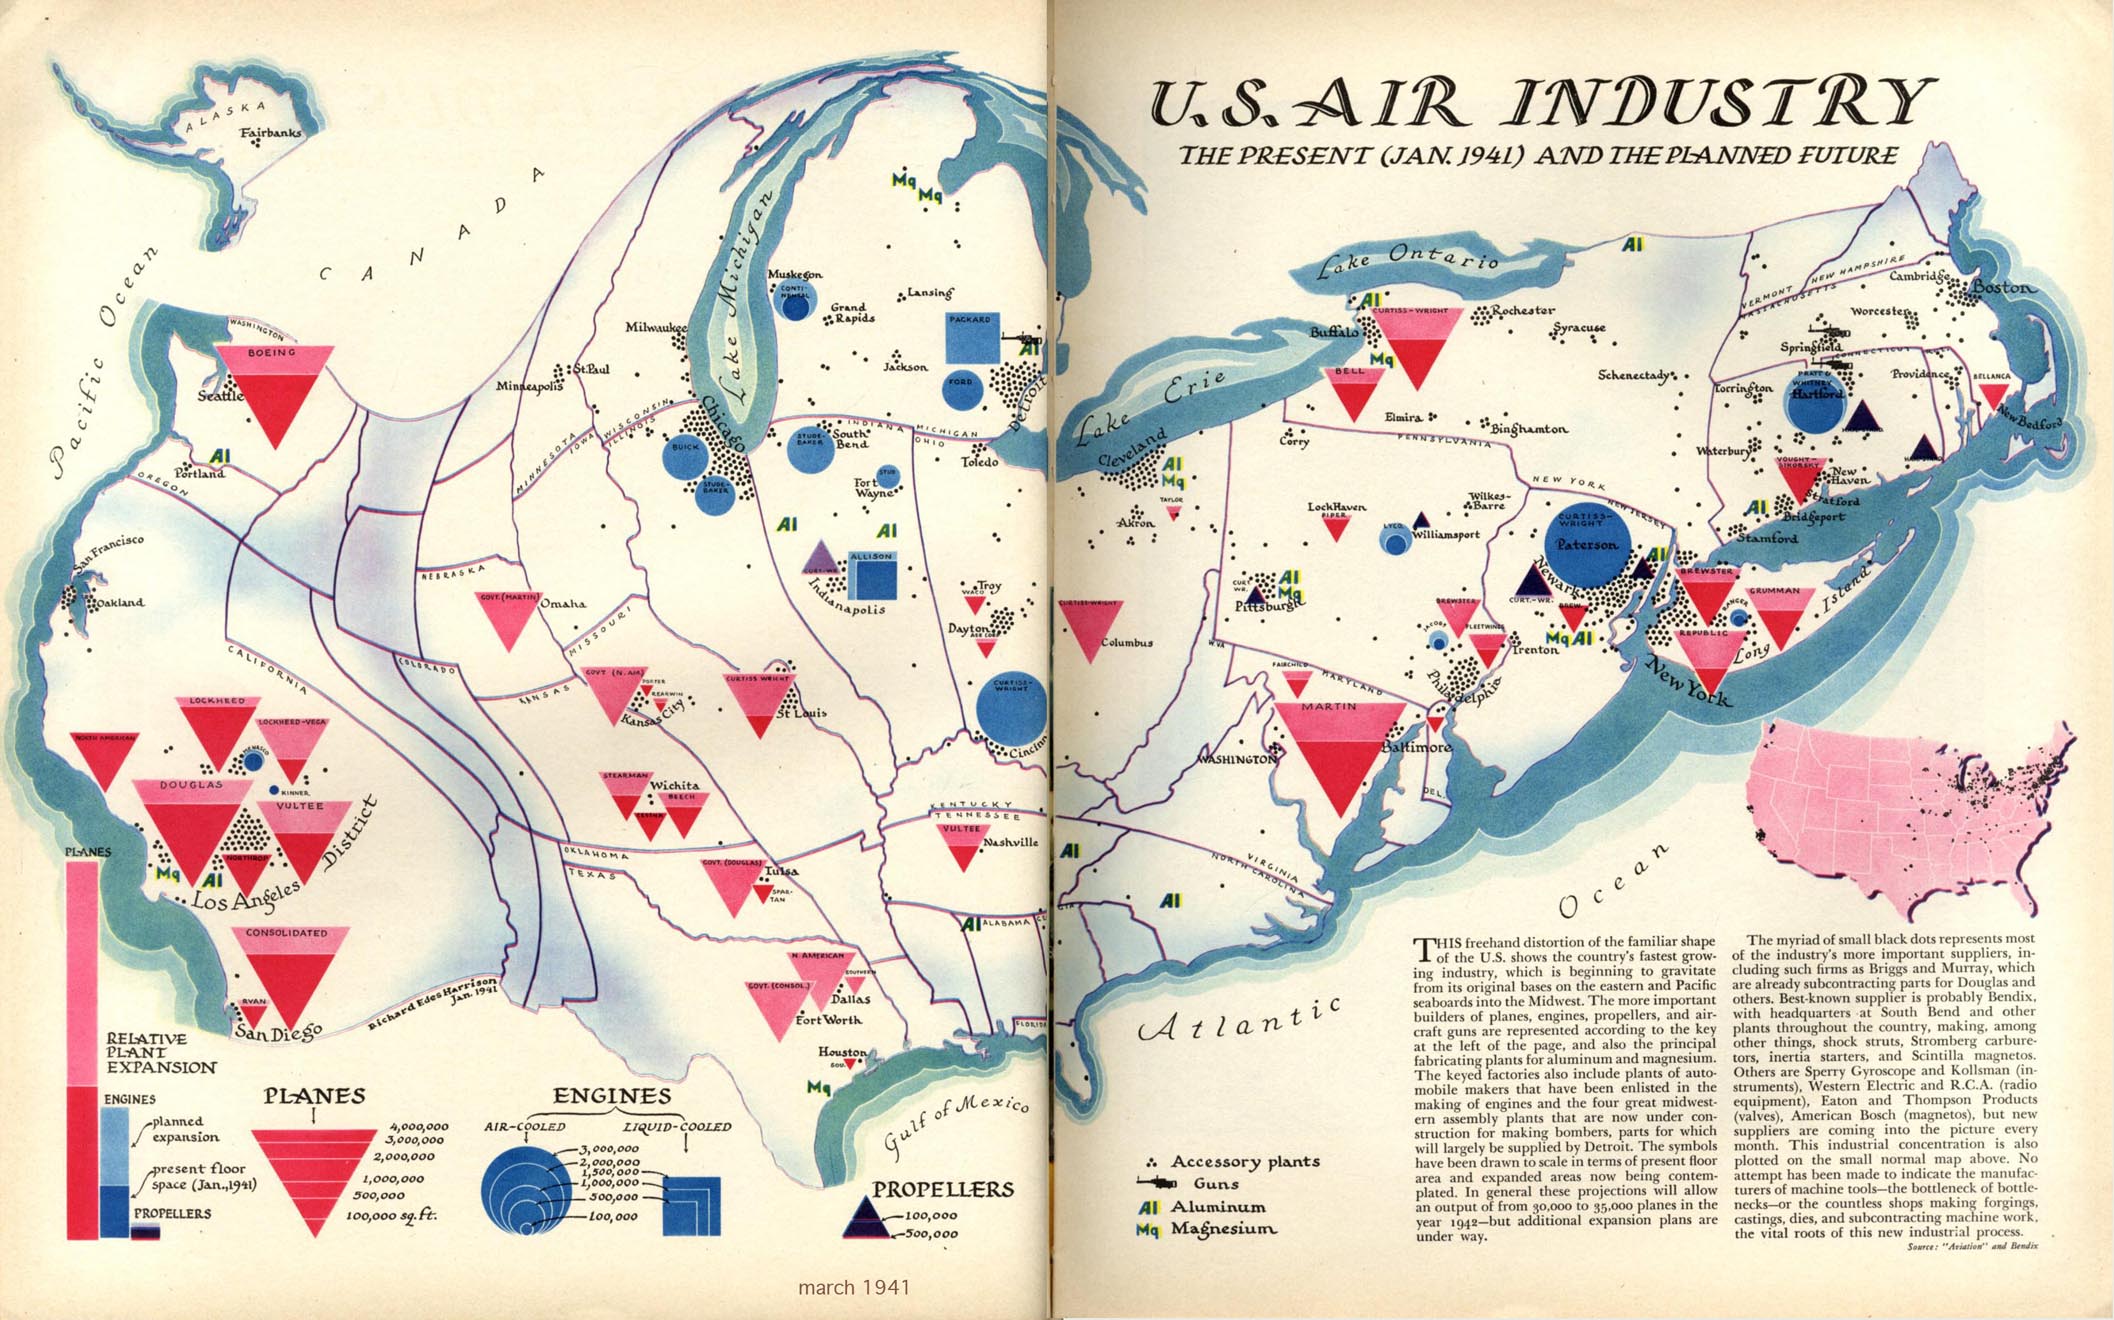
From Fortune, 1941. By Richard Edes Harrison.
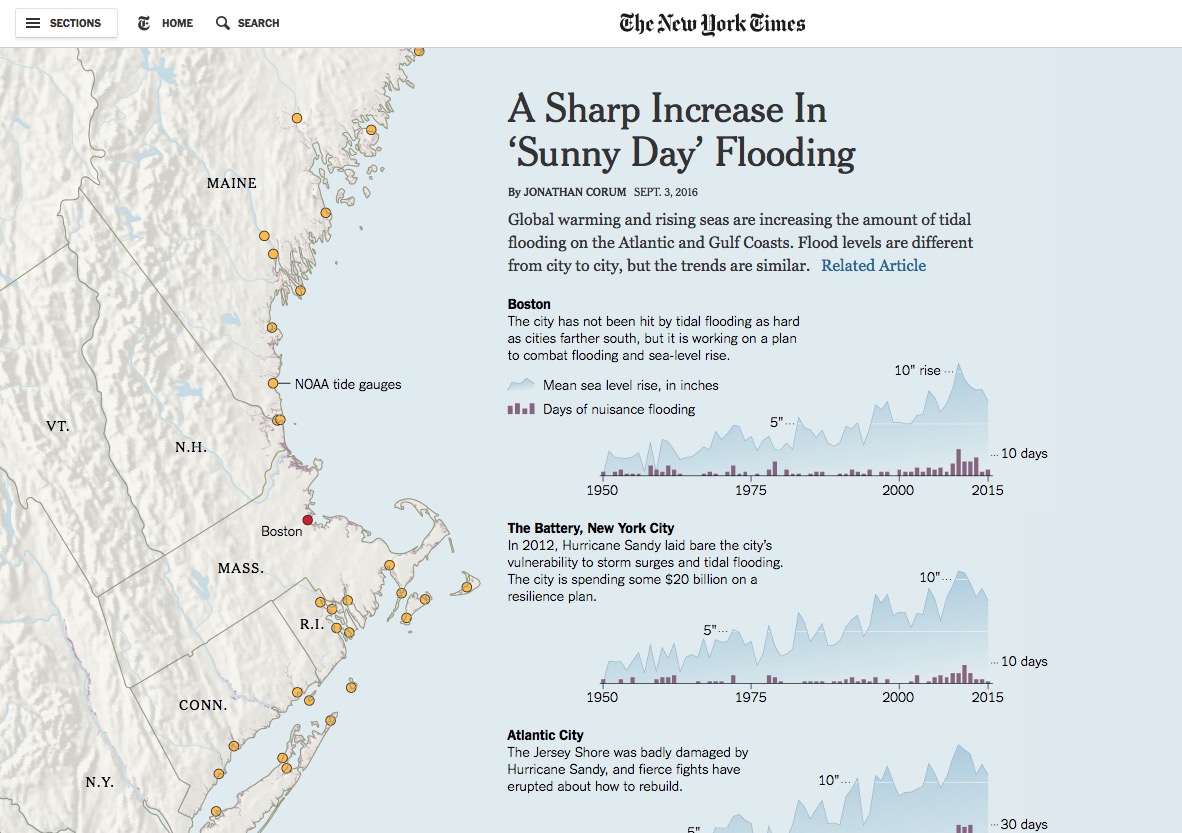
A Sharp Increase in “Sunny Day” Flooding, by Jonathan Corum, New York Times, 2016.