Infographic Examples
GDES-270 fall 2019 (David Ramos, American University Design)
ramos@american.edu · office hours
Examples of information graphics that combine different types or scales of data.
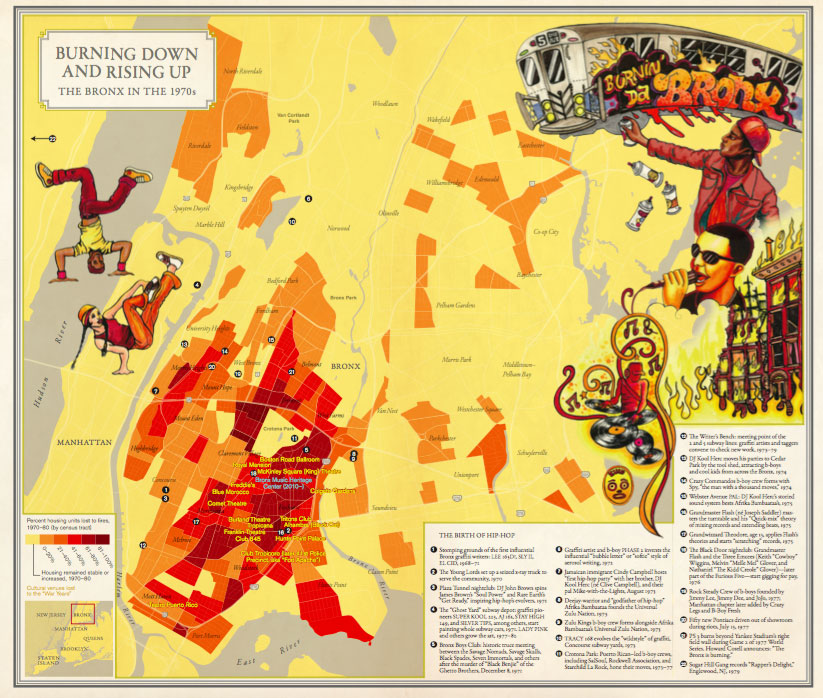
Rebecca Solnit and Joshua Jelly-Schapiro, Nonstop Metropolis A New York City Atlas
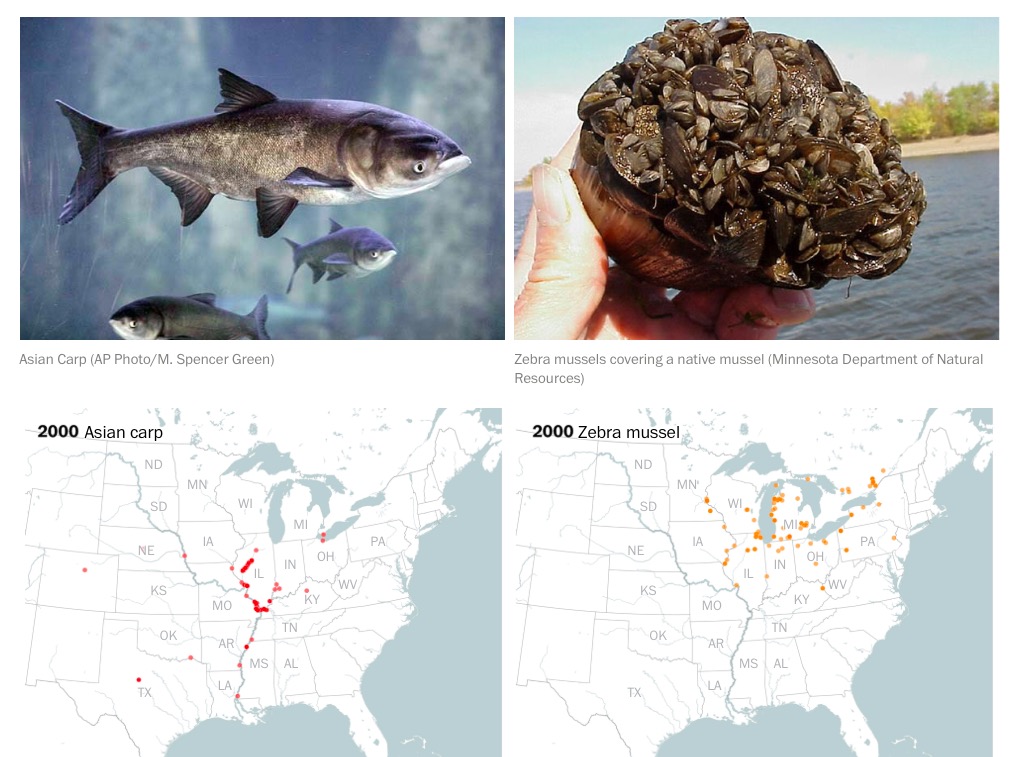
Los Angeles Times
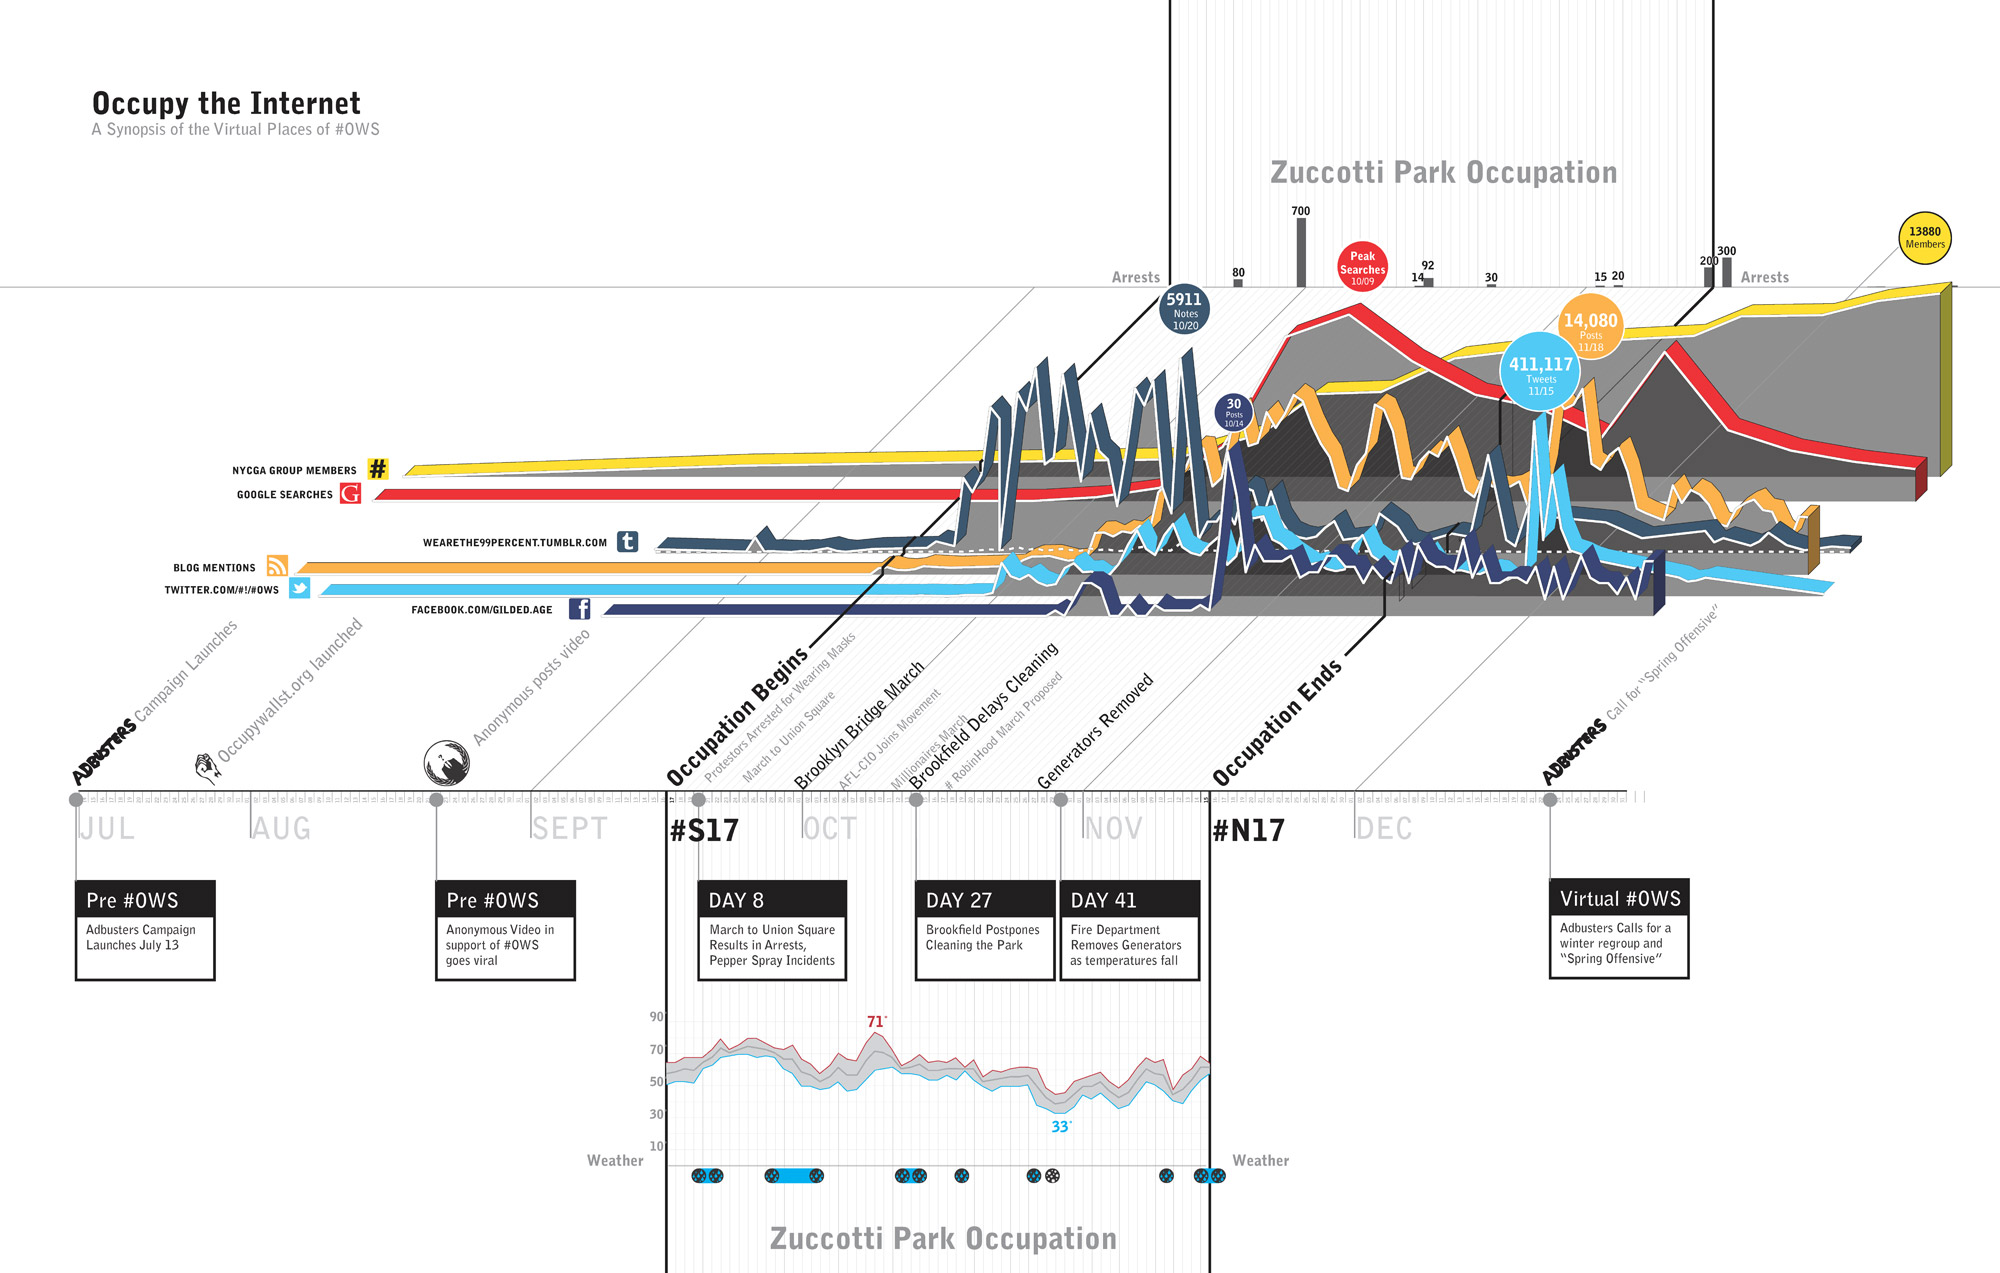
Jonathan Massey and Brett Snyder, Occupying Wall Street

Pekka Niittyvirta and Timo Aho for Taigh Chearsabhagh Museum & Arts Centre, lines of light marking water levels after sea level rise (more)
New York Times
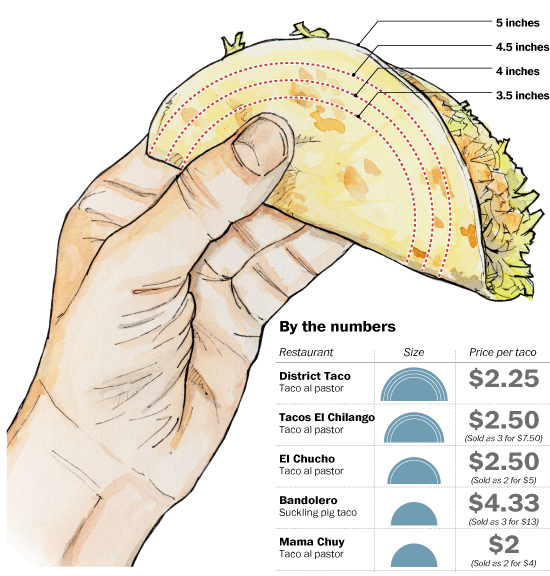
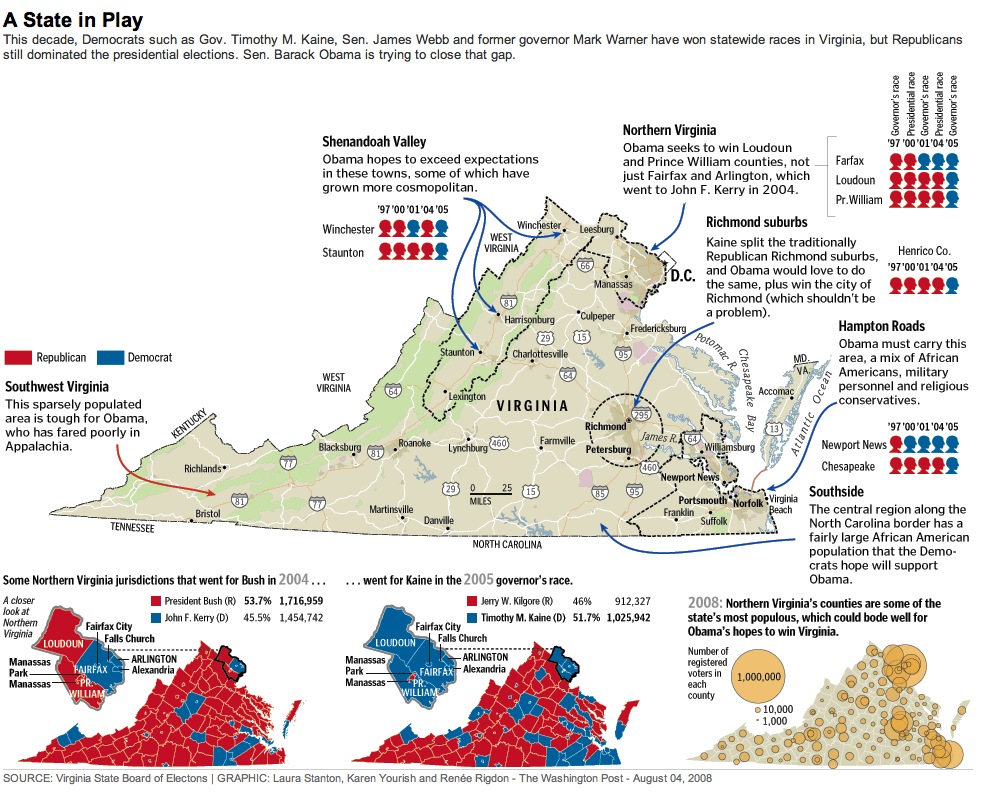
Alberto Cuadra, Lavanya Ramanathan and Justin Rude, Washington Post
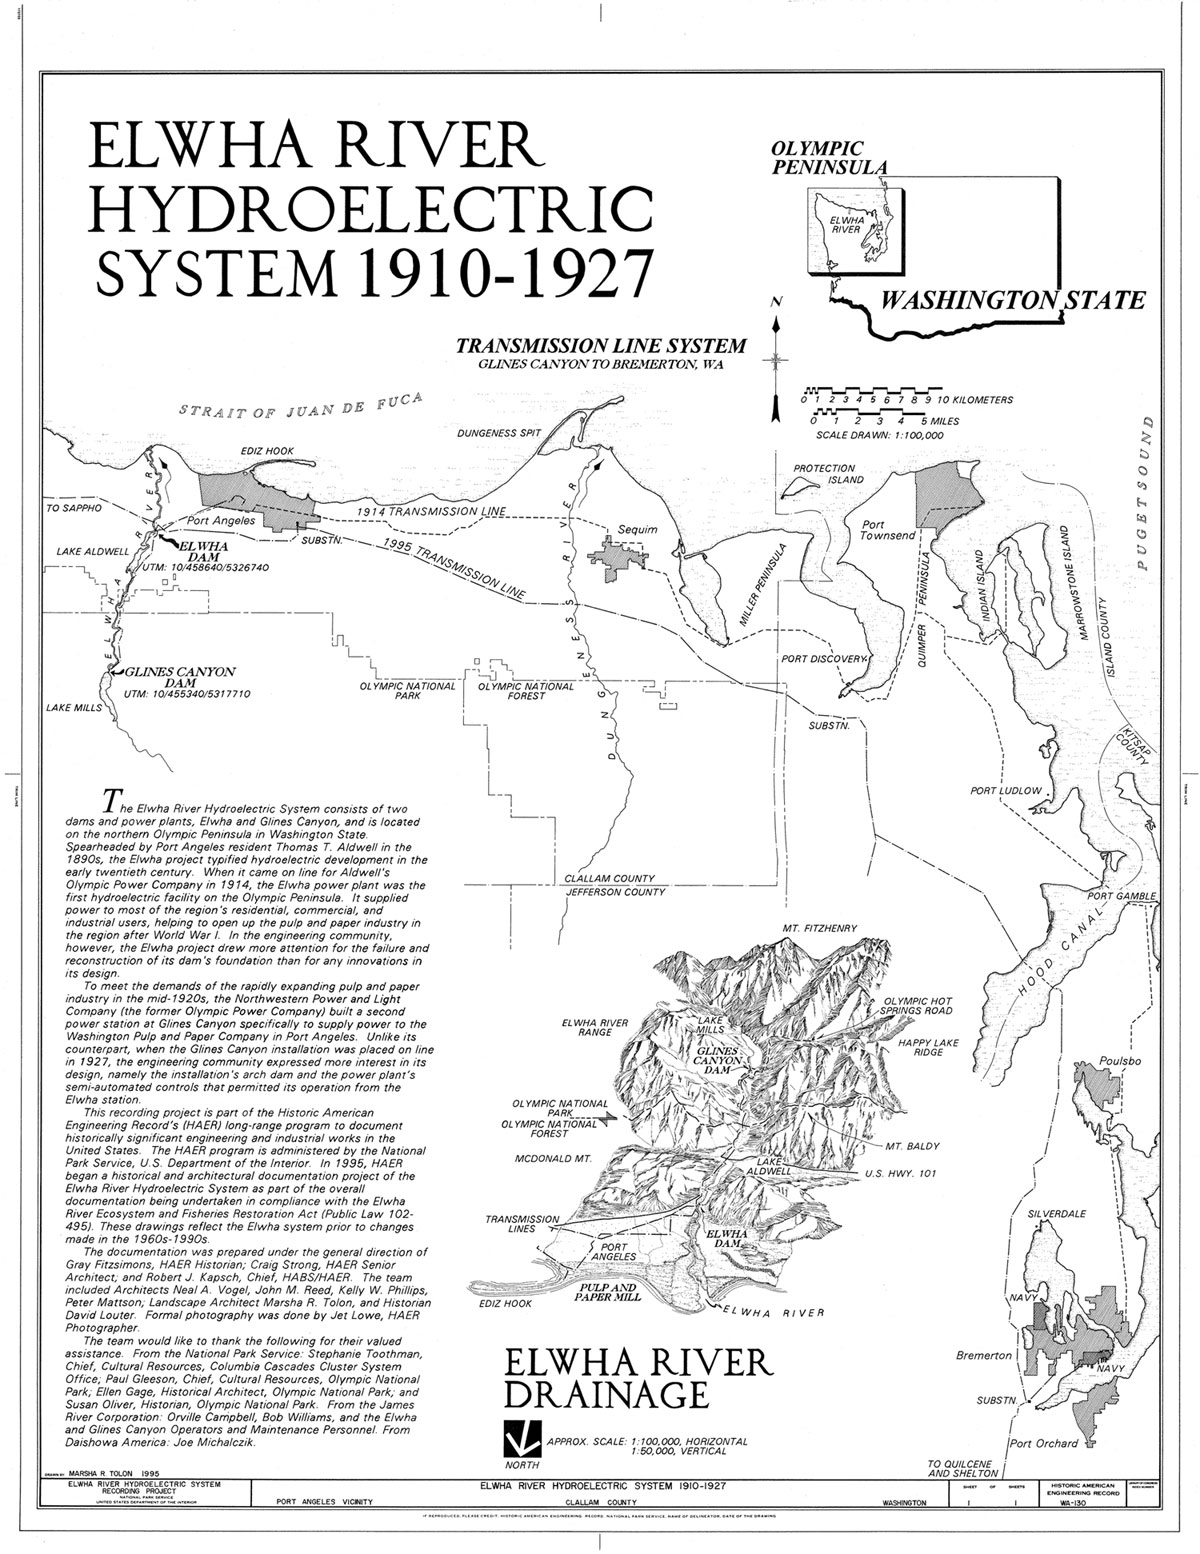
Historic American Buildings Survey/Historic American Engineering Record, National Park Service
New York Times
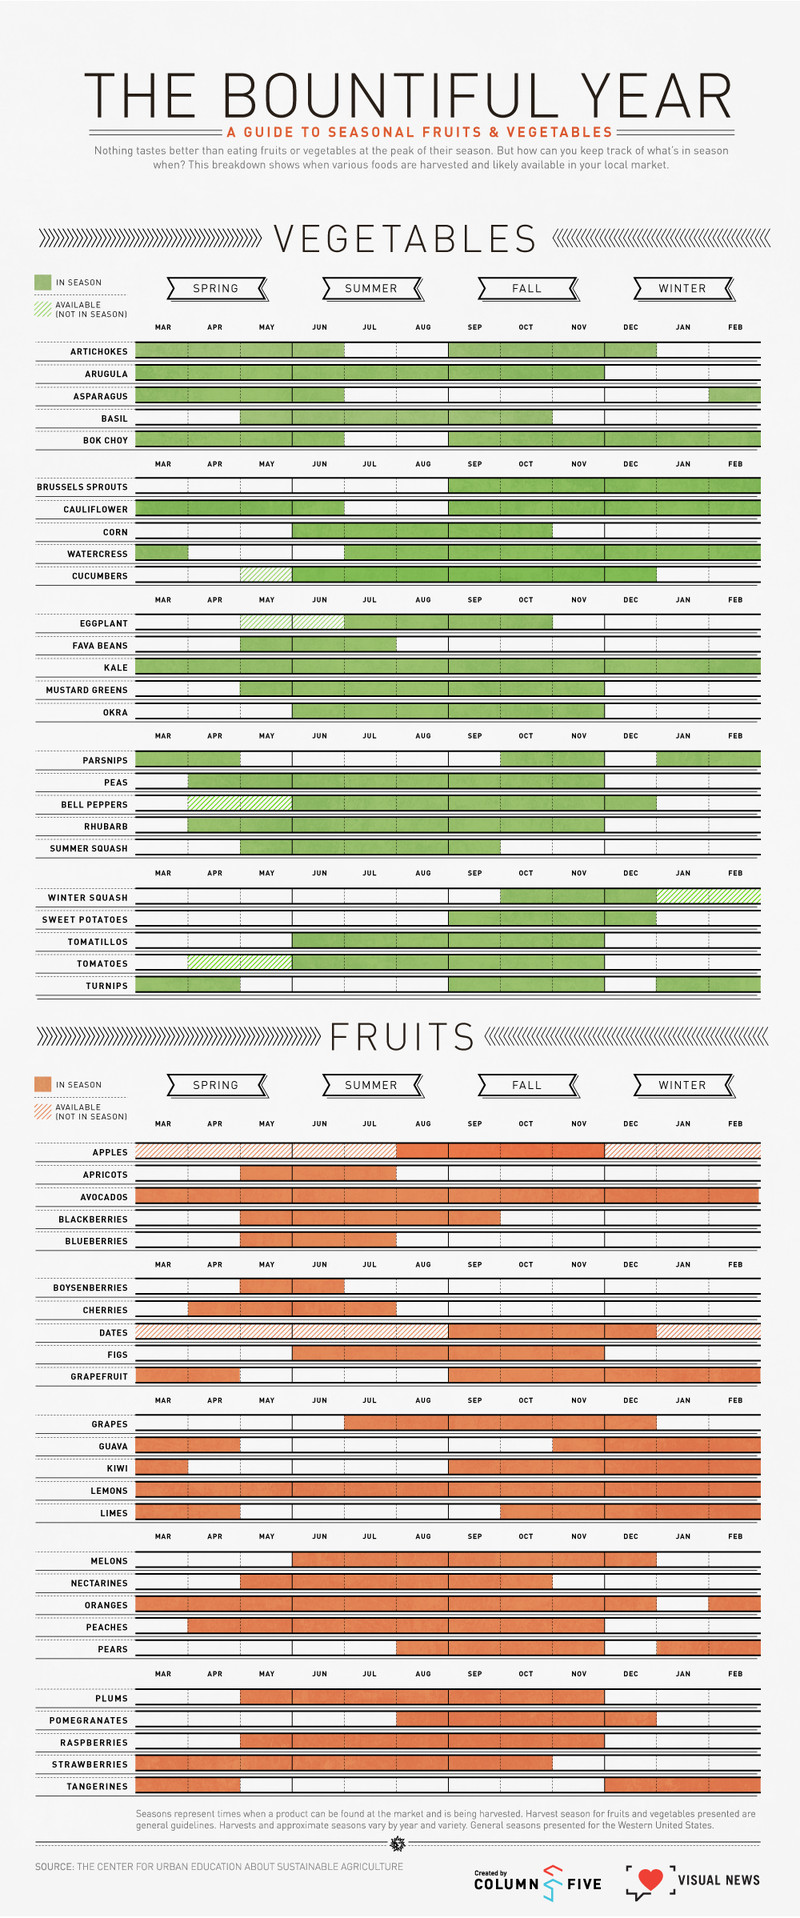
Column Five Media
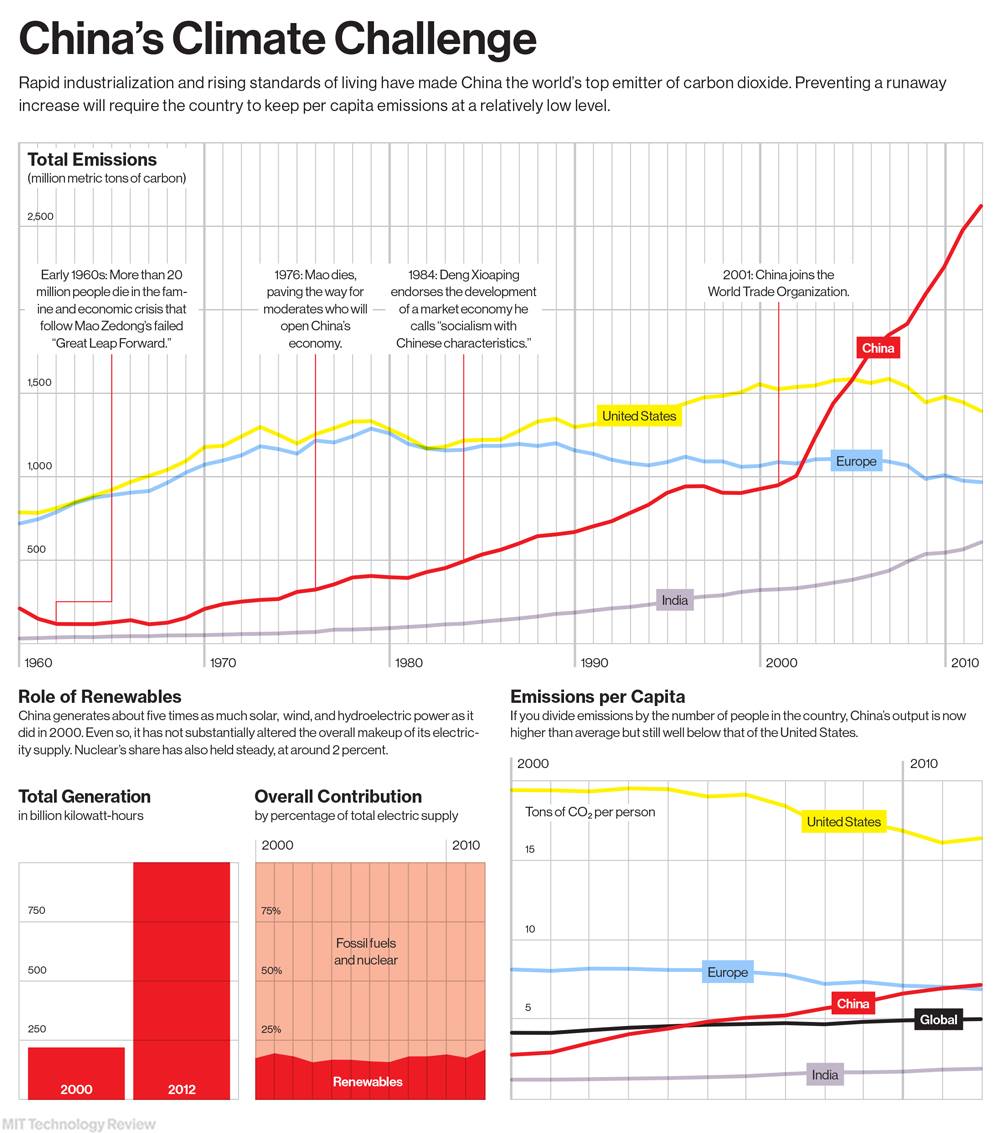
MIT Technology Review
Candy Chang
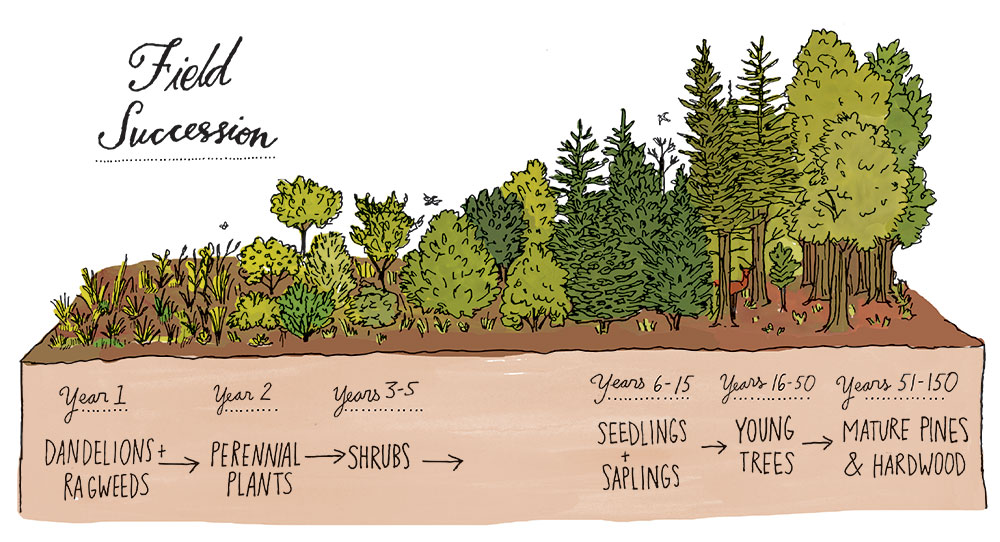
Julia Rothman
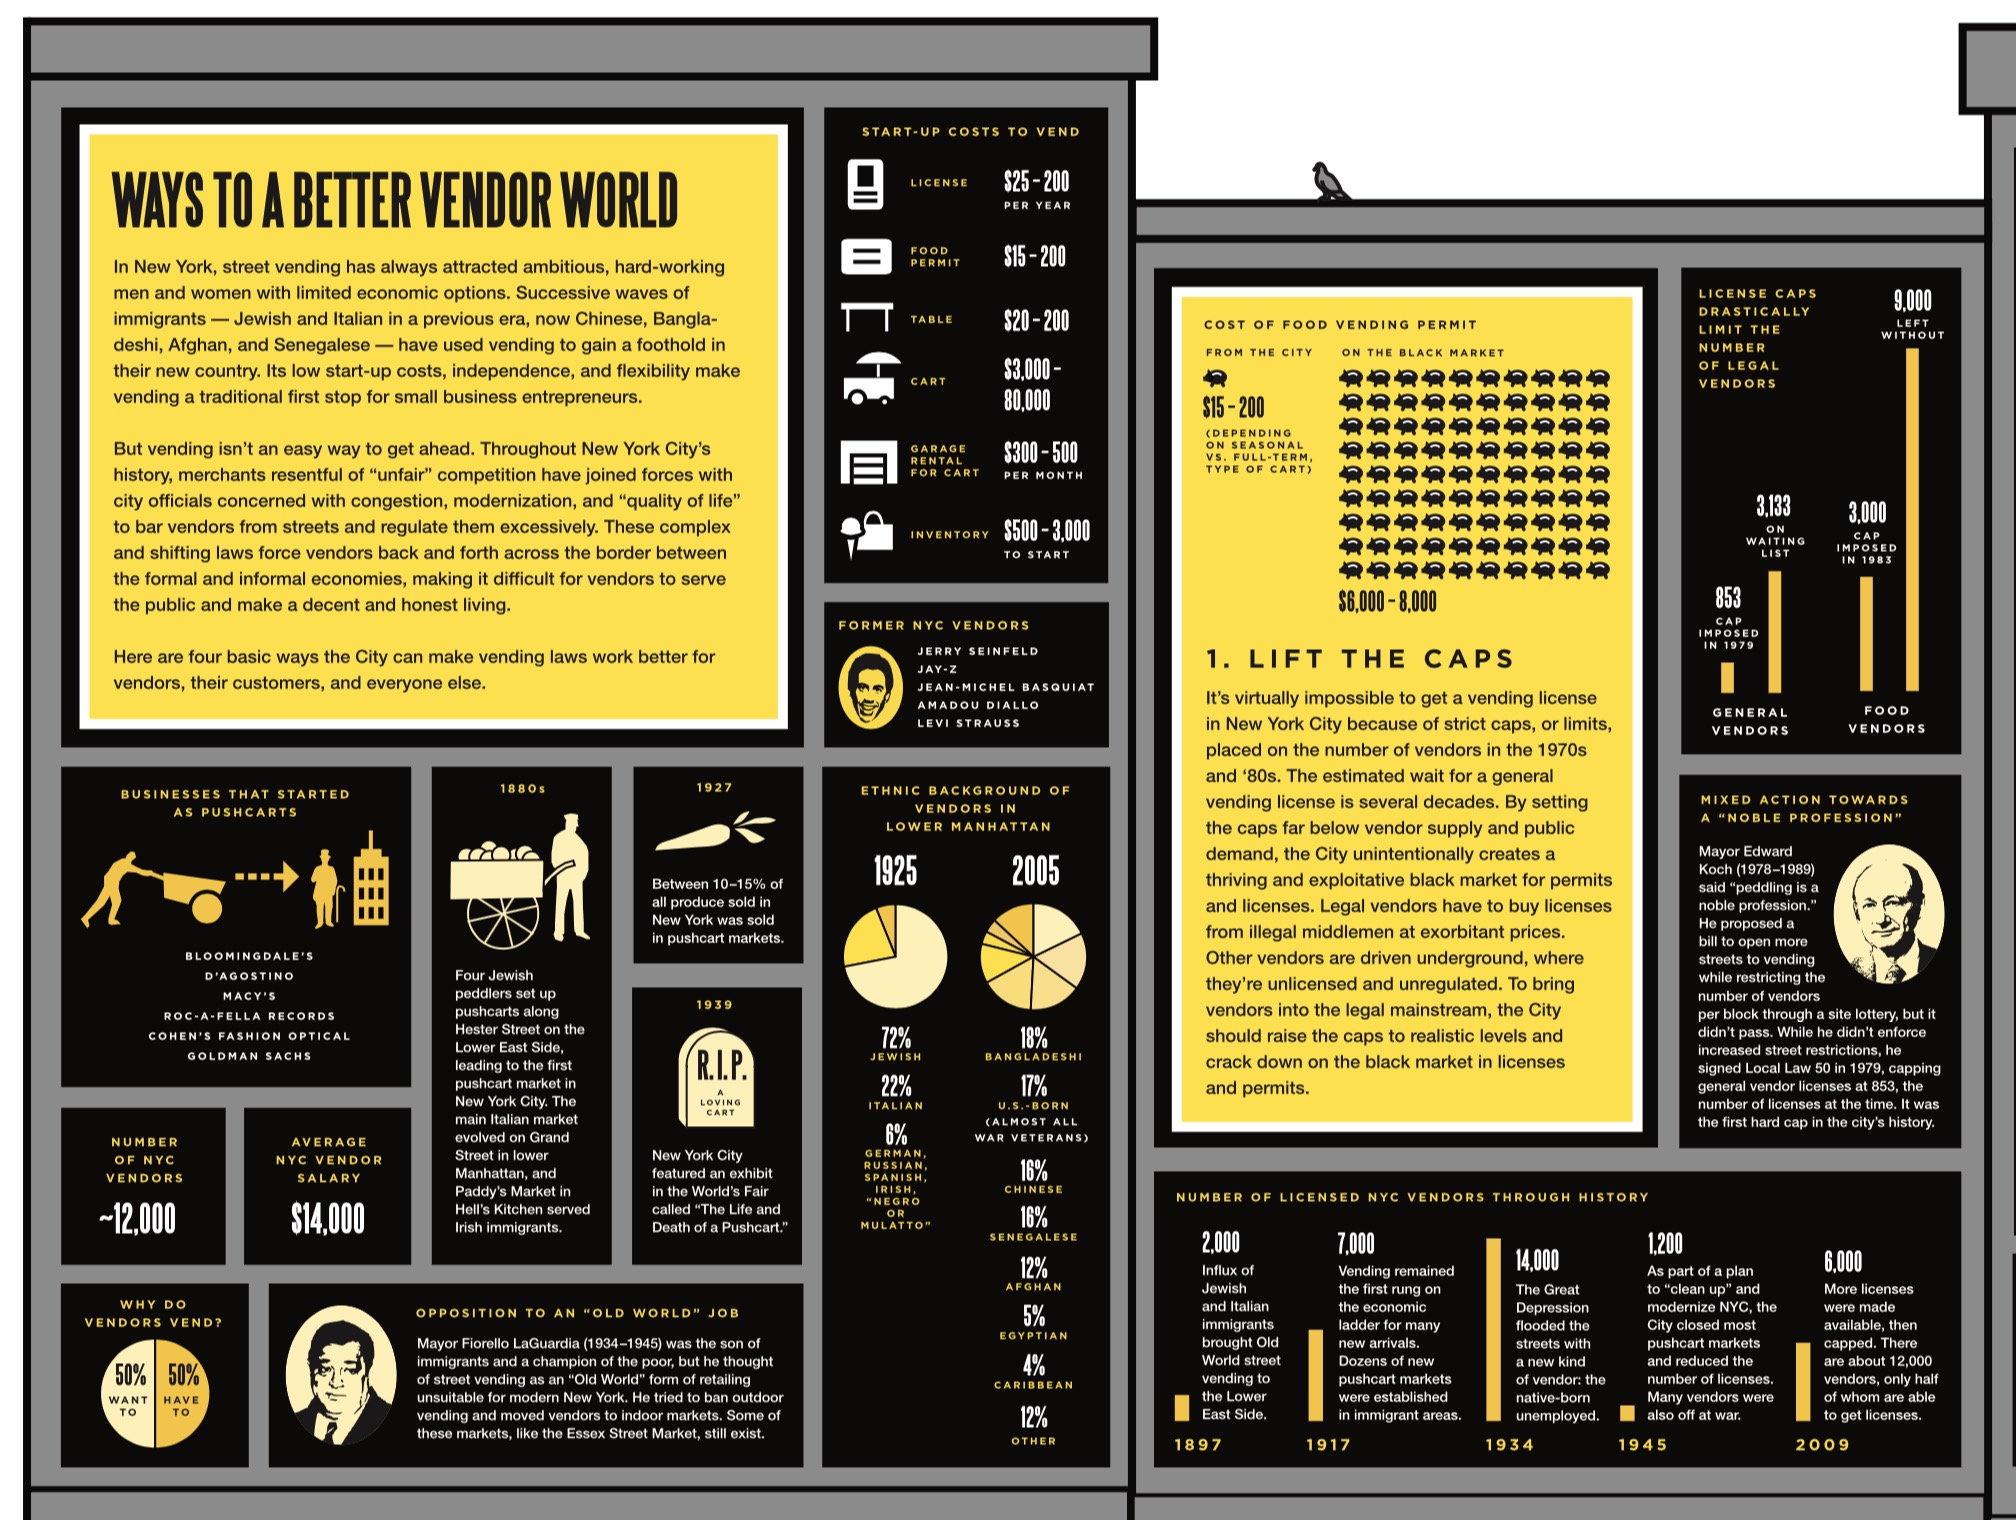
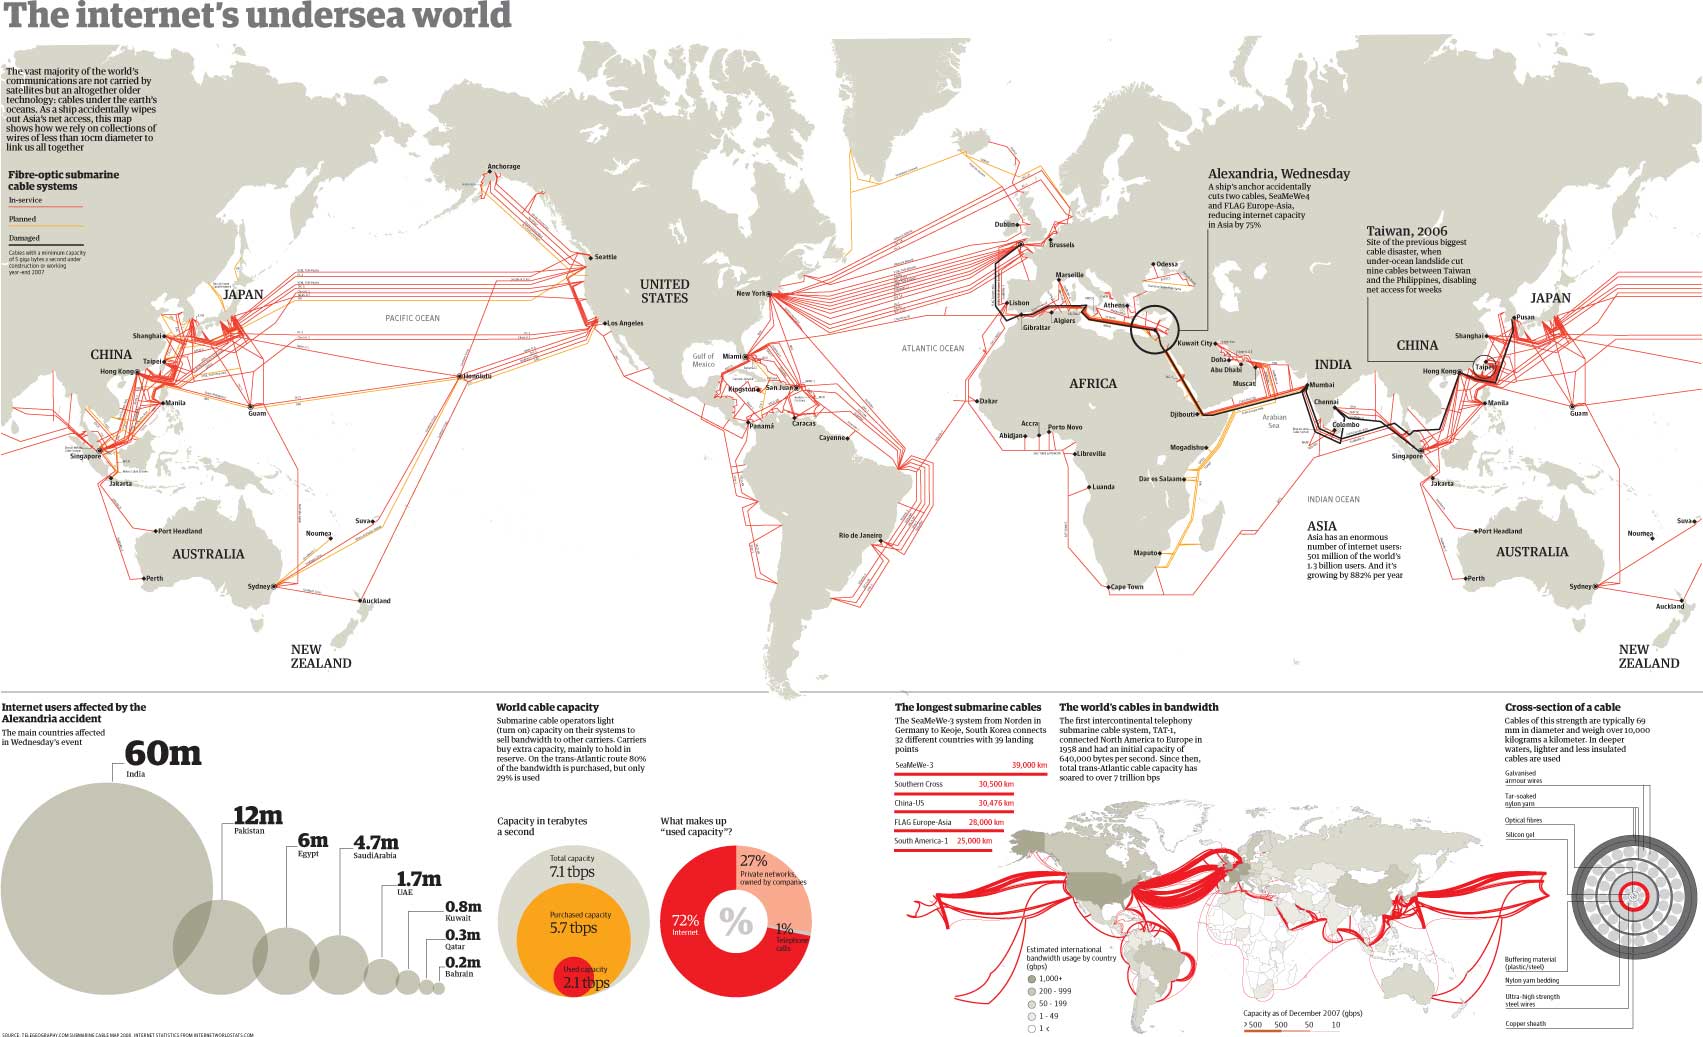
Washington Post
The Guardian
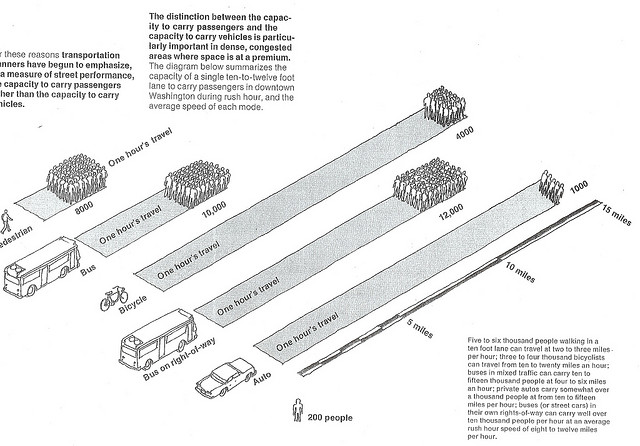
1977 Central Washington Civic Design and Transportation Study, National Endowment of Arts
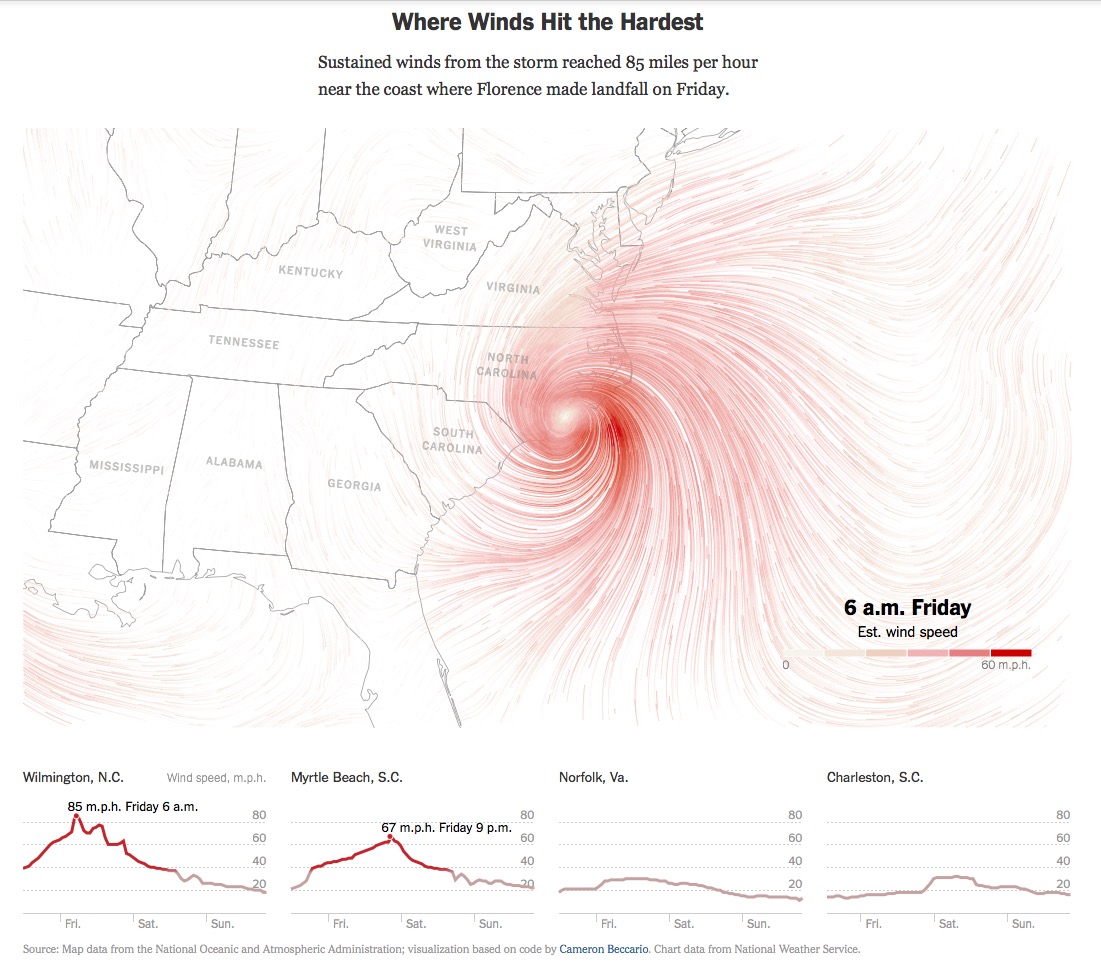
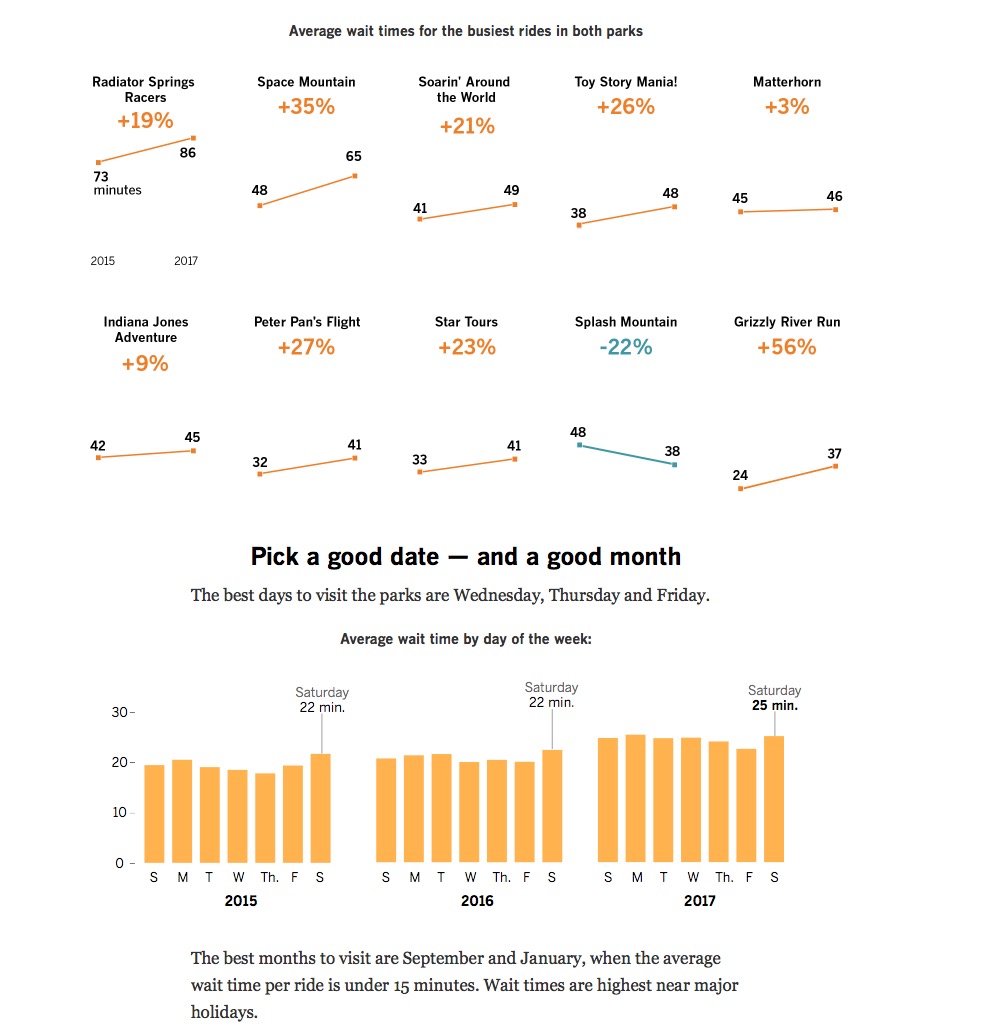
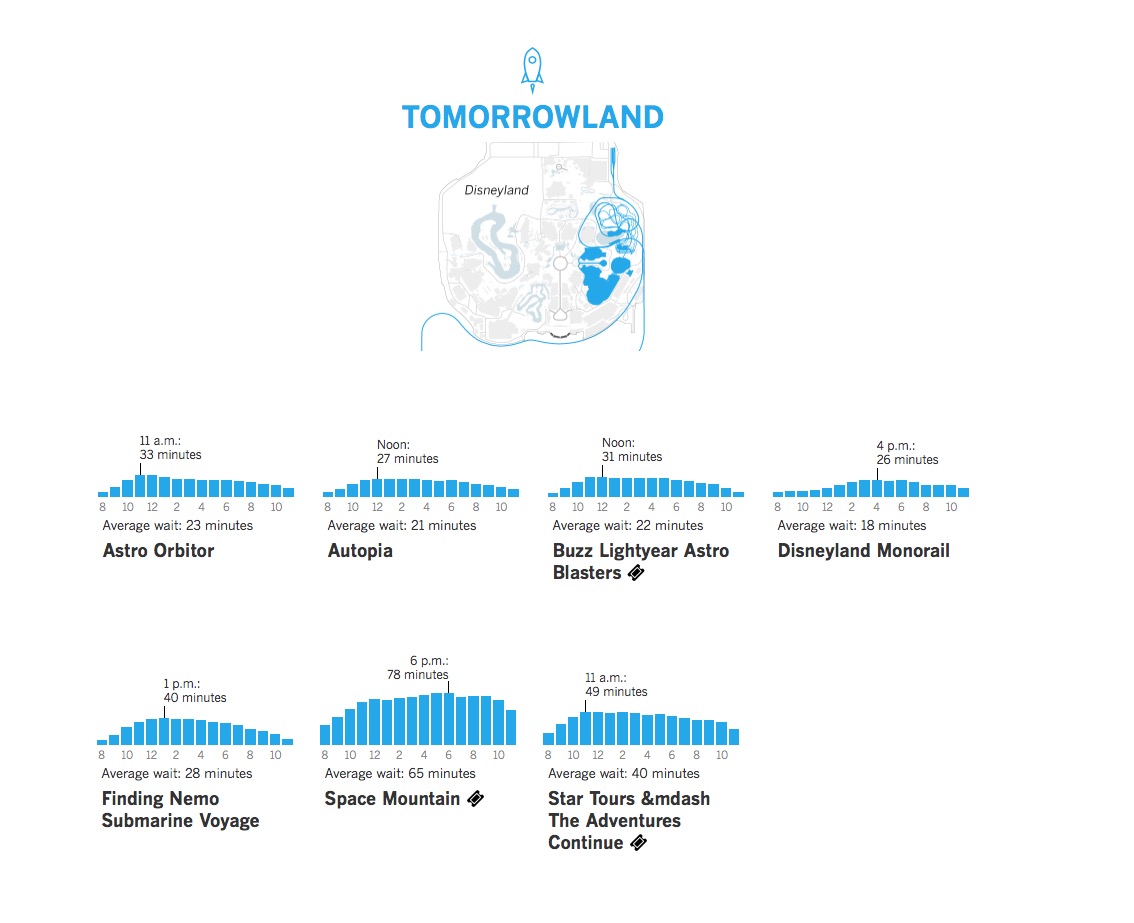
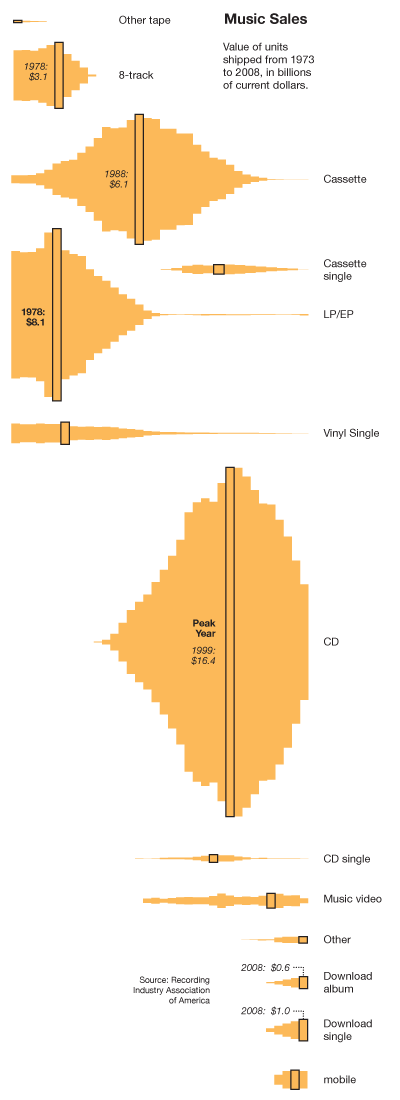
New York Times